
Stocks had their worst month since September 2023 in March, as investors fretted about the outlook for US economic growth, inflation and international trade. US stocks paced the retreat.
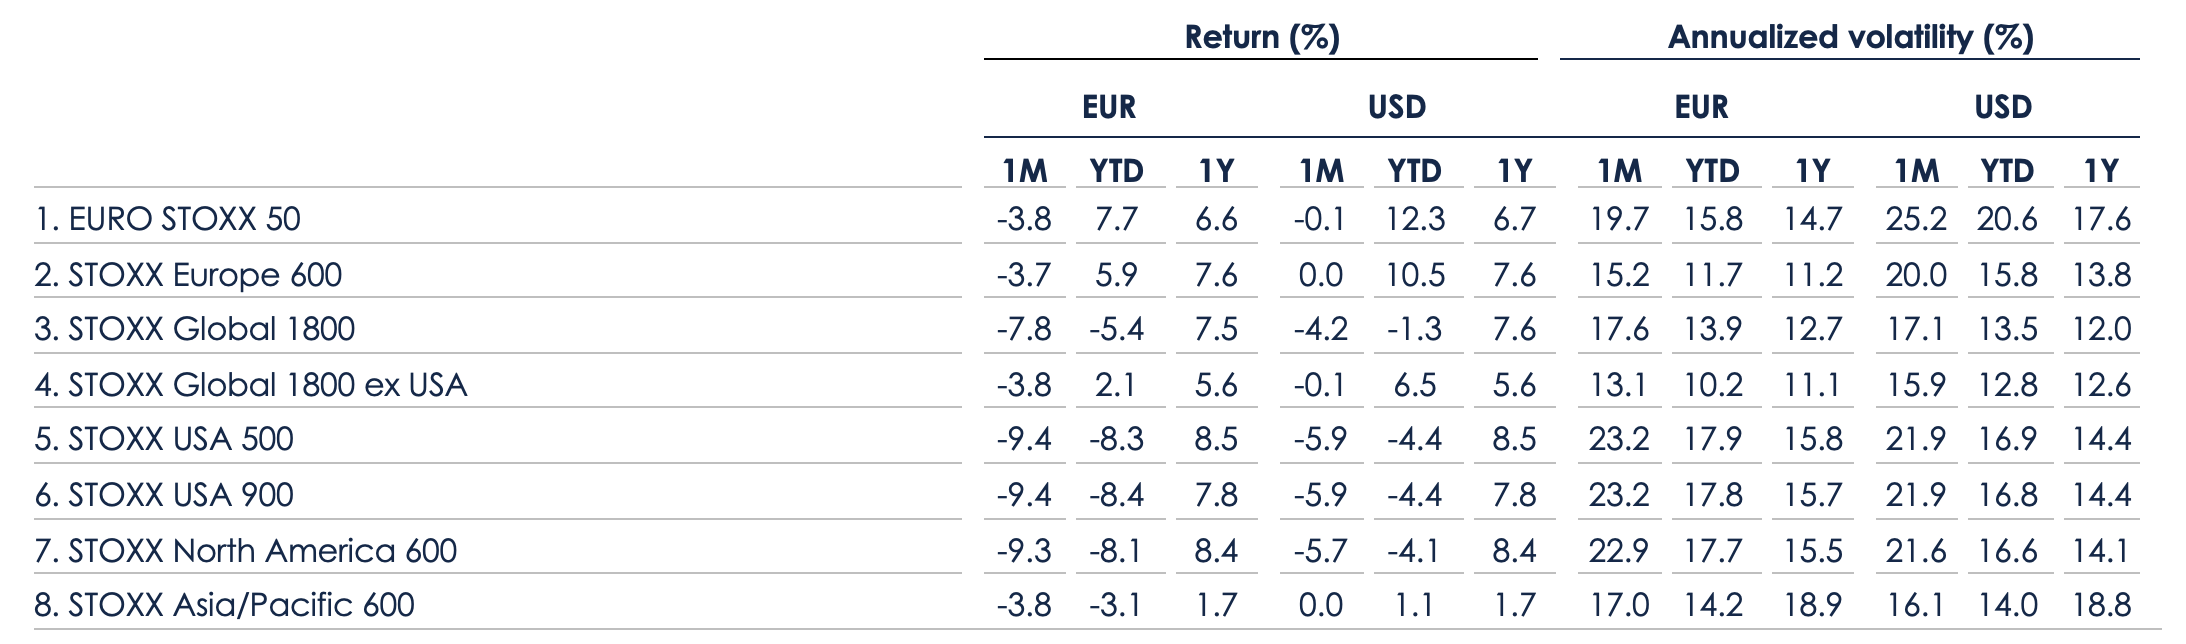
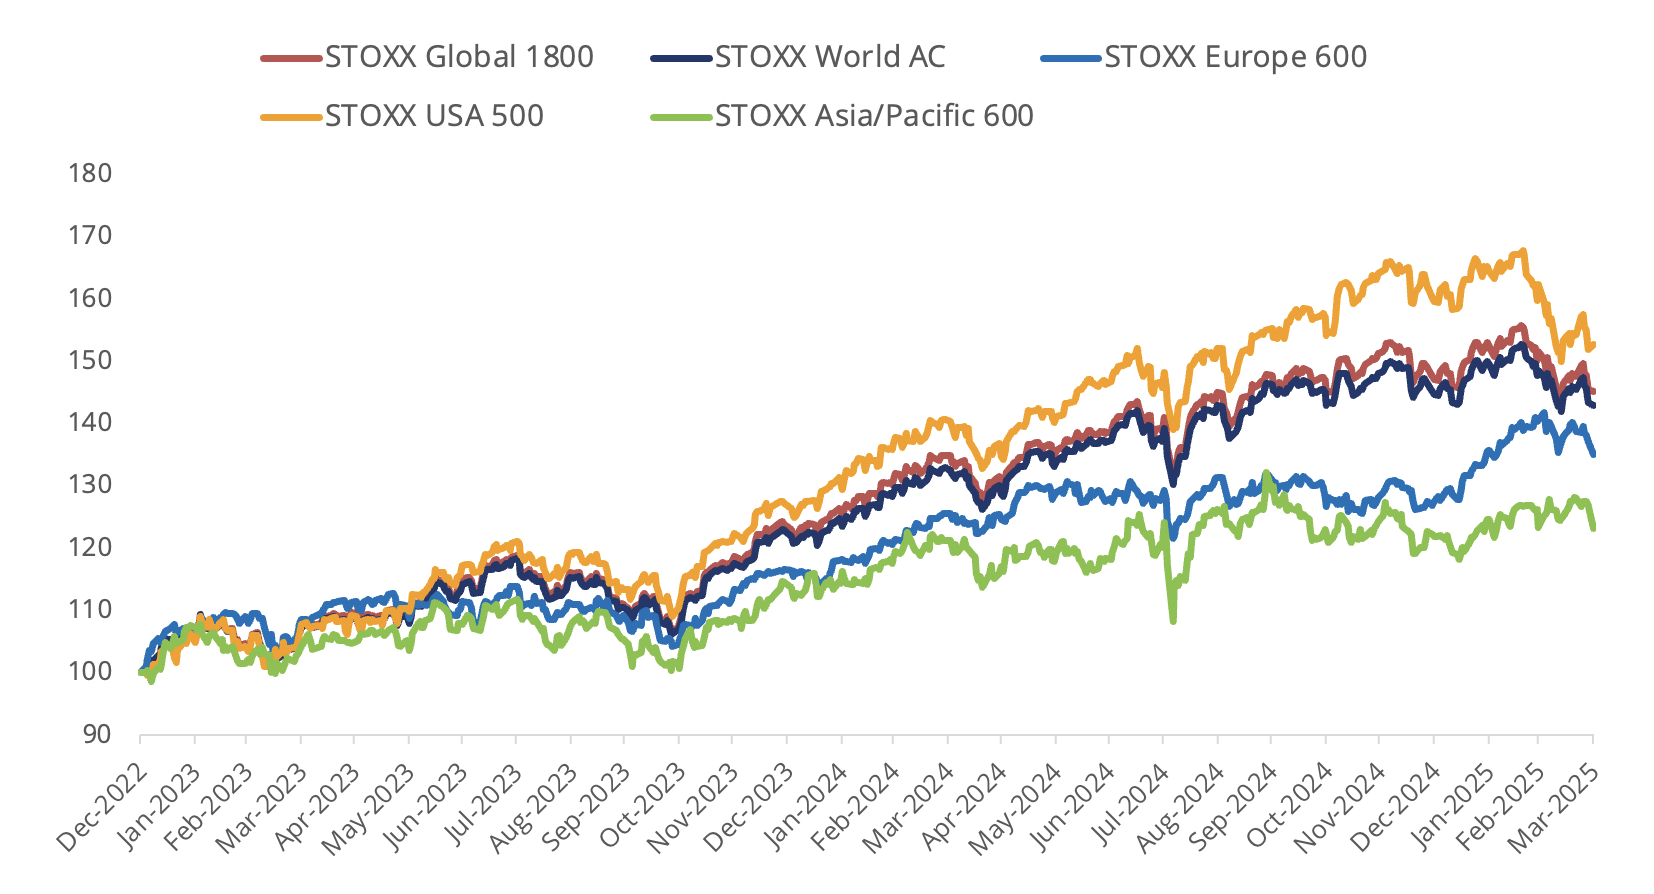
The STOXX® World AC slipped 3.8% last month when measured in US dollars and including dividends, and lost 5.3% in the first quarter, its worst quarter since the one ended in September 2023. The STOXX® Global 1800 index fell 4.2% in March and 1.3% over the quarter.
The Eurozone’s EURO STOXX 50® lost 3.8% in euros in March[1] but rose 7.7% in the quarter. The pan-European STOXX Europe 600 slid 3.7% and gained 5.9%, respectively.
The STOXX® North America 600 tumbled 5.7% in dollars last month. The STOXX USA 500 declined 5.9% and posted its worst quarter relative to the STOXX Europe 600 since 2015.
The STOXX® Asia/Pacific 600 was little changed over March. The STOXX® Developed World fell 4.3% in March and the STOXX® Emerging Markets gained 0.7%.
Figure 1: STOXX Equity World indices’ March risk and return
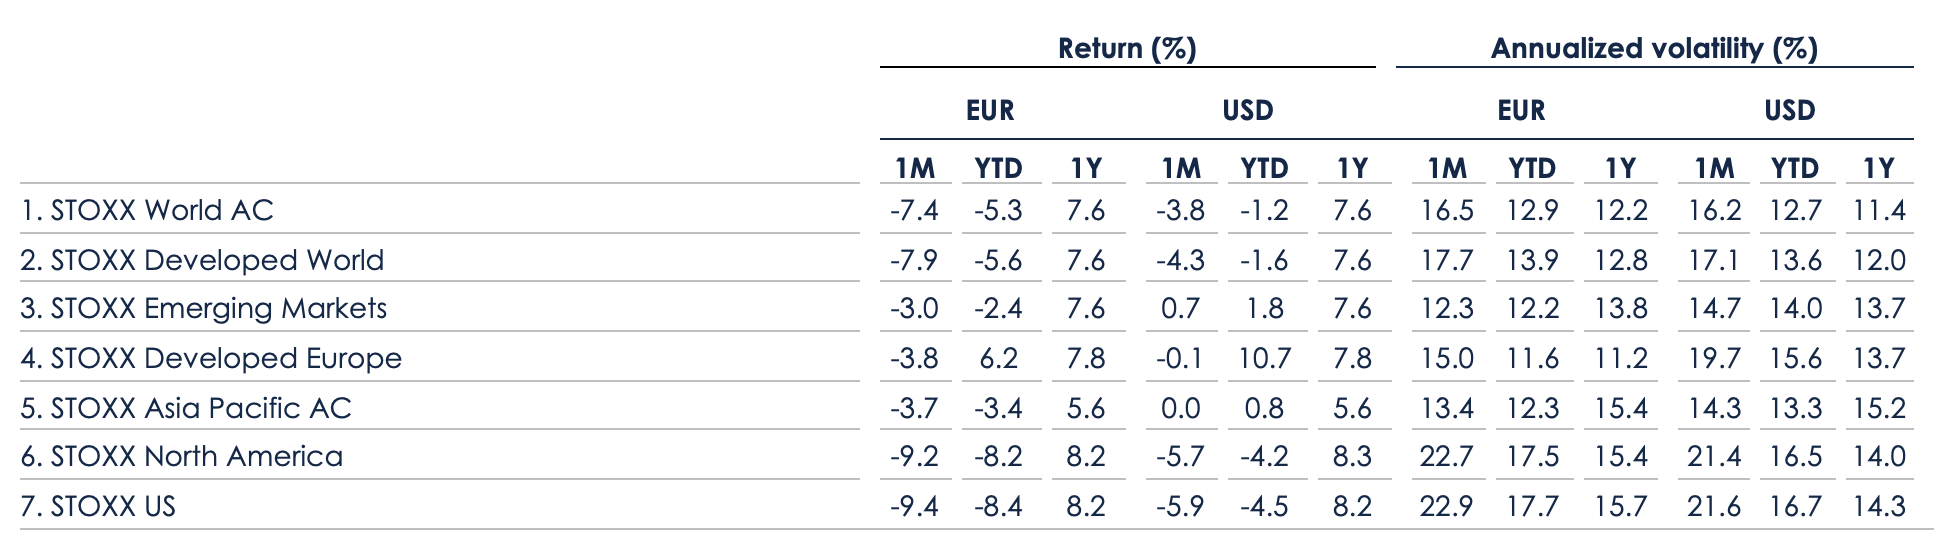
Figure 2: STOXX Benchmark indices’ March risk and return
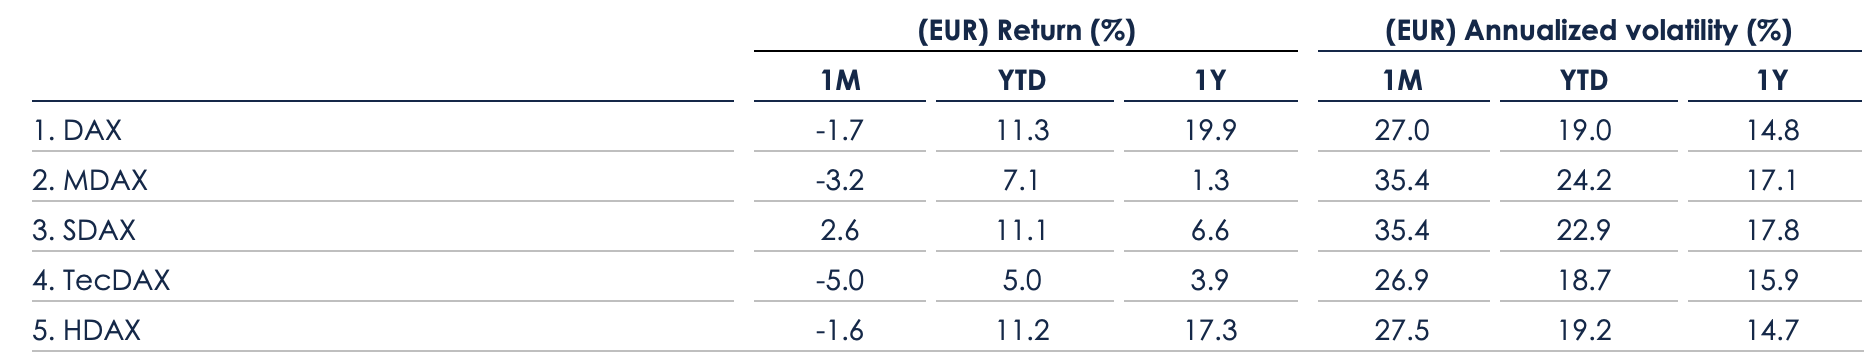
Germany’s DAX® decreased 1.7% in the month. MDAX®, which gauges the performance of German mid-caps, lost 3.2%.
Figure 3: DAX indices’ March risk and return
| For a complete review of all indices’ performance last month, visit our March index newsletter. |
Trade, economy
Investors have become more concerned in recent weeks that President Trump’s threat to impose import tariffs will take a toll on global trade and boost consumer prices. US inflation and consumer sentiment readings over the month were worse than expected, further dampening the outlook for the world’s largest economy.
Figure 4: Total annual % returns for STOXX World AC index
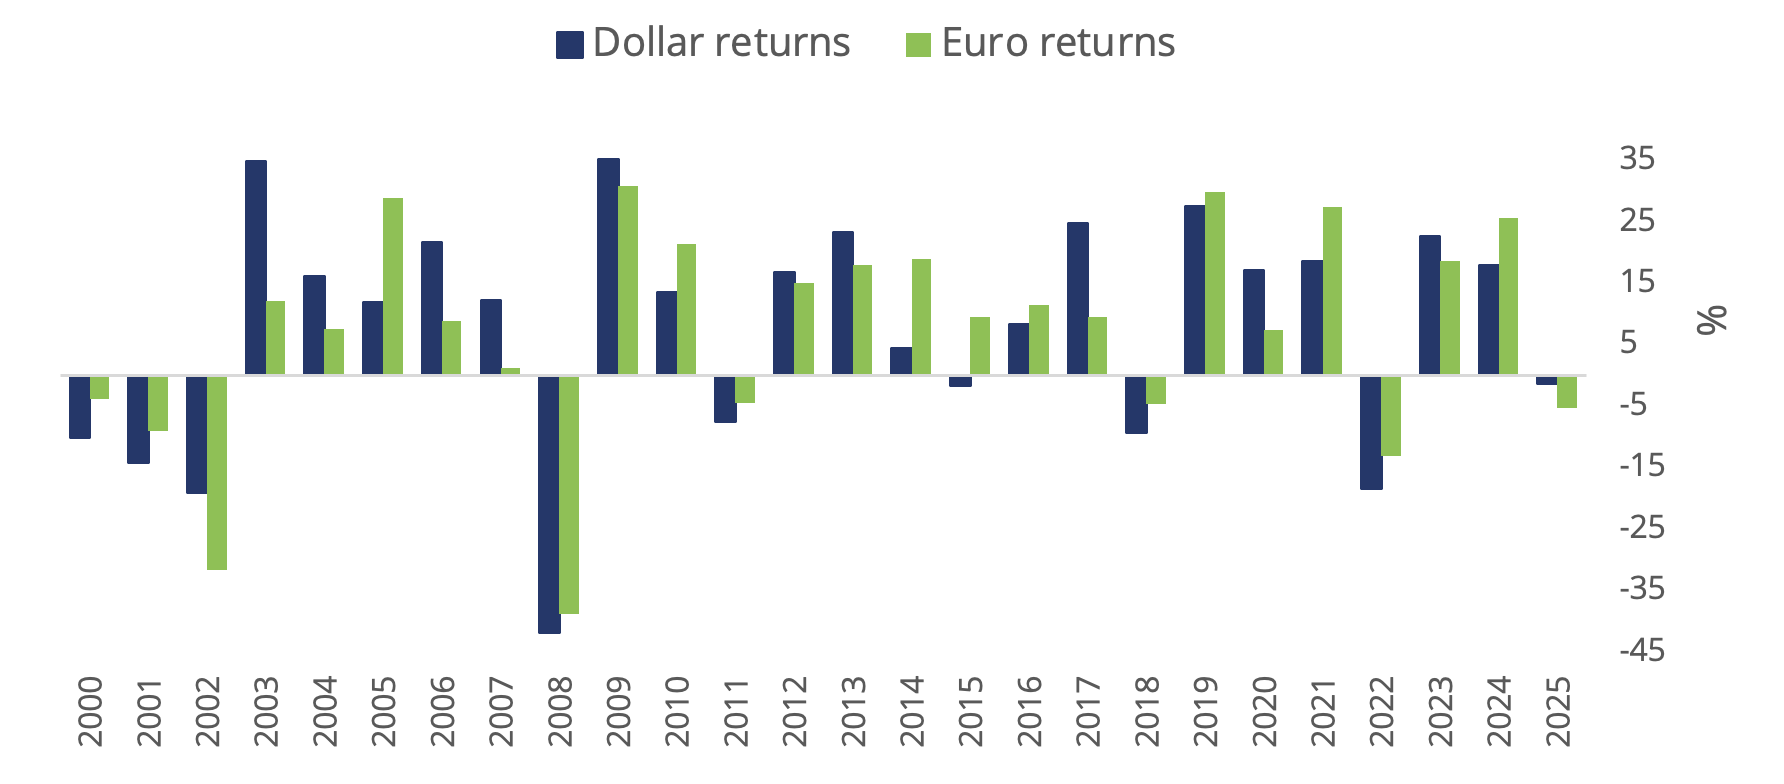
Figure 5: Select STOXX benchmarks’ returns since 2023
Volatility rises
The VSTOXX® (Eurozone equity volatility), which tracks the prices of EURO STOXX 50 options traded on Eurex, rose to 22.1 from 18.6 in February. A higher VSTOXX reading suggests investors are paying up for puts that offer insurance against stock price drops. The VDAX®, which measures volatility in German equities, climbed to 22 from 19.2 a month earlier.
Factor investing
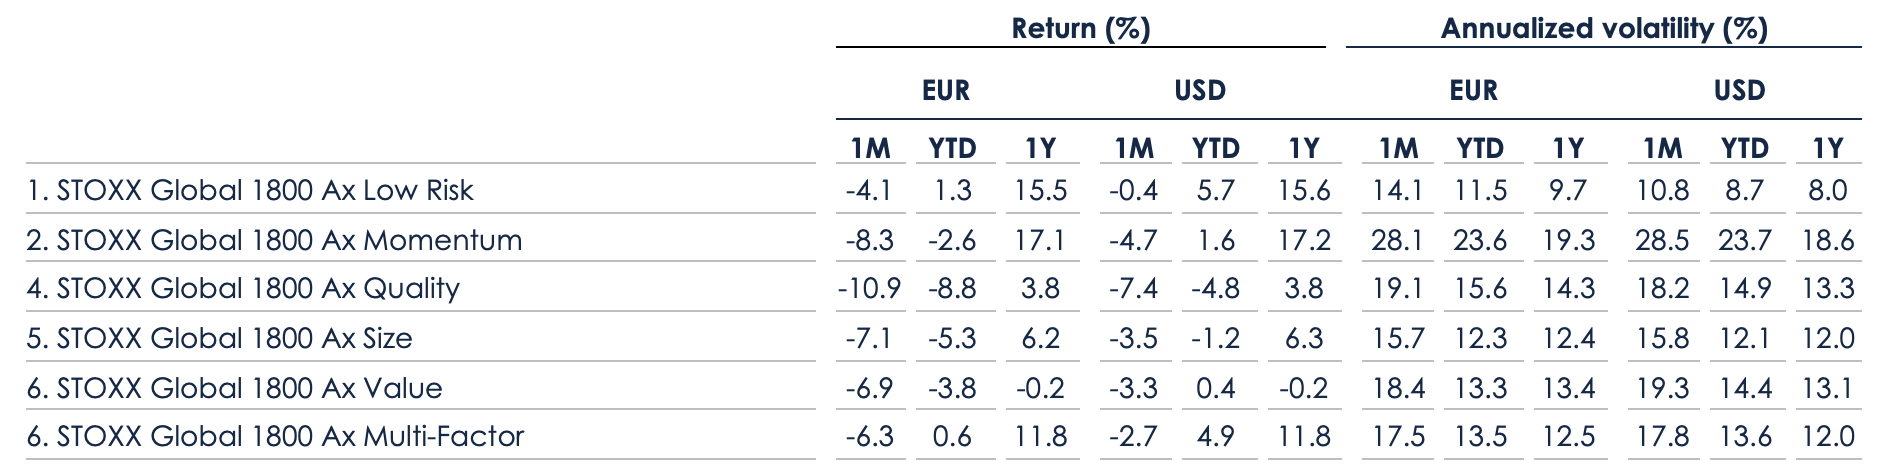
Among the STOXX Factor indices, the Quality signal led losses last month, while Low Risk outperformed (Figure 6).
Figure 6: STOXX Factor (Global) indices’ March risk and return characteristics
Climate benchmarks
Within climate benchmarks, the ISS STOXX® Developed World Net Zero Transition dropped 4.6%. The index is focused on net-zero targets and real-world transition-aligned metrics, and includes all industries featured in the parent universe.
The STOXX® Global 1800 Paris-Aligned Benchmark (PAB) fell 5%, while the STOXX® Global 1800 Climate Transition Benchmark (CTB) lost 4.9%. The PAB and CTB indices follow the requirements outlined by the European Commission’s climate benchmarks regulation.
Sustainability indices
The STOXX® Global 1800 ESG-X index dropped 4.8% in the month. The STOXX® ESG-X indices are versions of traditional, market capitalization-weighted benchmarks that observe standard responsible exclusions.
The DAX® ESG Screened fell 3% in the month. The index reflects the composition of the DAX benchmark minus companies that fail to pass norms-based and controversial weapons screenings, meet minimum ESG ratings or are involved in certain business activities considered undesirable from a responsible investing perspective.
Within indices that combine exclusions and best-in-class ESG integration, the EURO STOXX 50® ESG index fell 3.4% over the month. Germany’s DAX® 50 ESG index (-2.4%)[2], which excludes companies involved in controversial activities and integrates ESG scoring into stock selection, underperformed the benchmark DAX in the month.
The STOXX® Global 1800 SRI lost 3.8%. The STOXX SRI indices apply a set of carbon emission intensity, compliance and involvement screens, and track the best ESG performers in each industry group within a selection of STOXX benchmarks.
Thematics, digital assets
Only 11 of 40 STOXX® Thematic indices outperformed the benchmark STOXX Global 1800 last month. The STOXX® Europe Luxury 10 index (-11.9%) had the worst performance in the suite after leading gains for three consecutive months. The STOXX® Global Silver Mining (11.5%), on the other hand, came out on top last month.
The STOXX® Digital Asset Blue Chip index, which aims to track high-quality assets that represent the crypto universe today, lost 6.1% in the month.
Dividend strategies
Dividend strategies had better returns than benchmarks in the month that ended. The STOXX® Global Maximum Dividend 40 (-0.2% on a net basis) selects only the highest-yielding stocks. The STOXX® Global Select Dividend 100 (+0.8%) tracks companies with sizeable dividends but also applies a quality filter such as a history of stable payments.
Minimum variance
Minimum variance strategies also outperformed last month. The STOXX® Global 1800 Minimum Variancefell 1.6% and the STOXX® Global 1800 Minimum Variance Unconstrained advanced 1.4%.
The STOXX Minimum Variance Indices come in two versions. A constrained version has similar exposure to its market capitalization-weighted benchmark but with lower risk. The unconstrained version, on the other hand, has more freedom to fulfill its minimum variance mandate within the same universe of stocks.
[1] Throughout the article, all European indices are quoted in euros, while global, North America, US, Japan and Asia/Pacific indices are in US dollars.
[2] Figures in parentheses show last month’s gross returns.