
Stocks rose in September as the Federal Reserve cut its key interest rate for the first time in more than four years, in what investors expect was the start of an easing cycle in monetary policy.
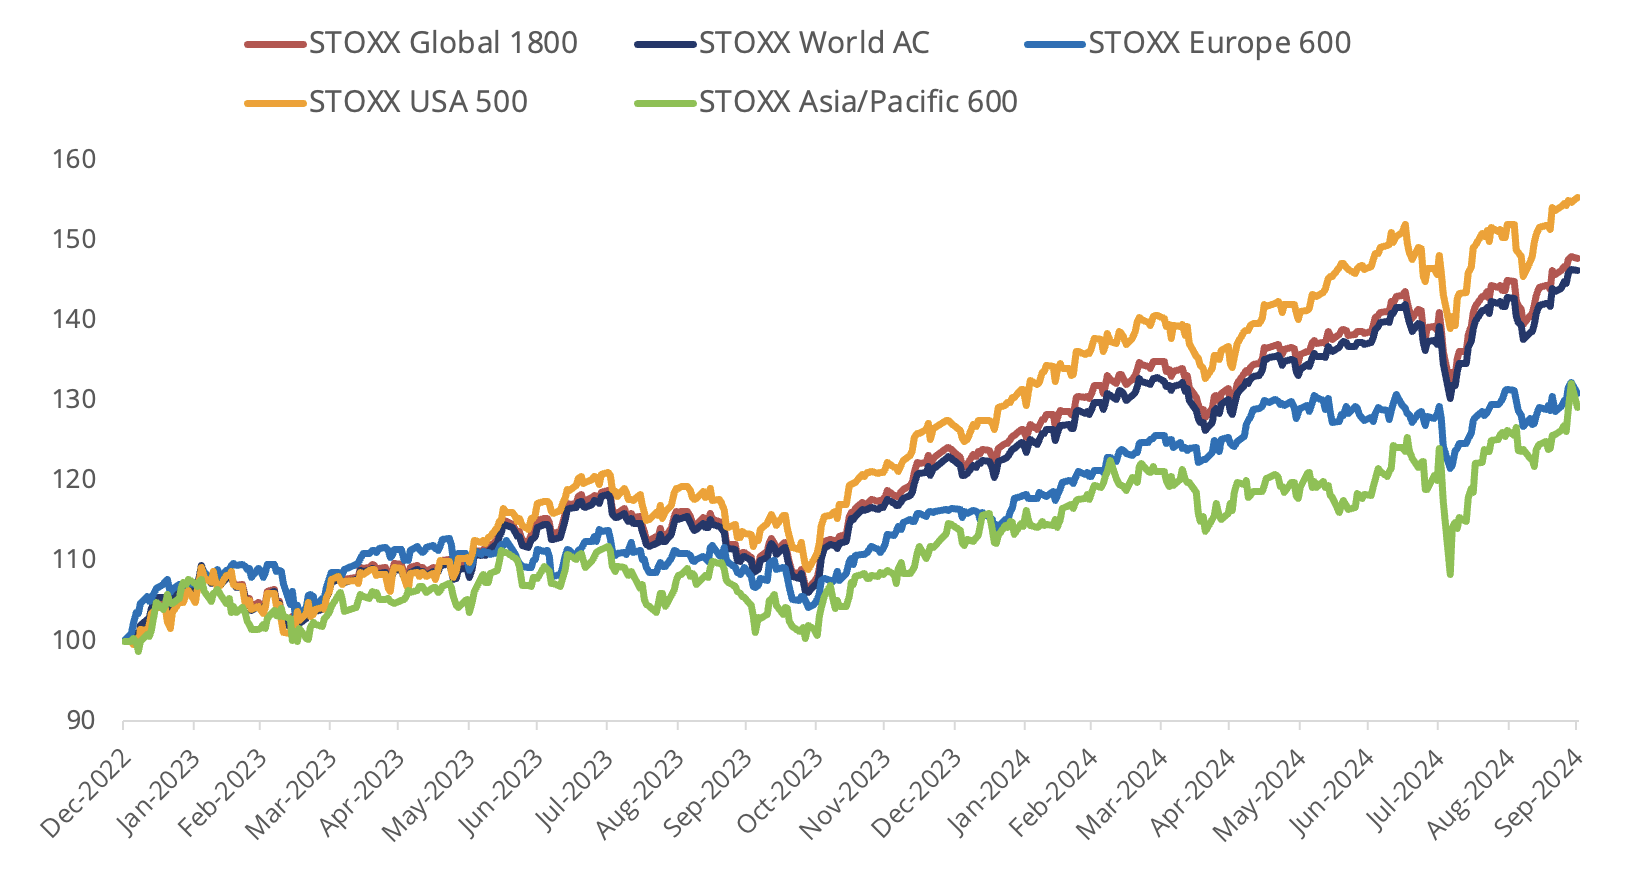
The STOXX® World AC index rose 2.4% last month when measured in US dollars and including dividends[1], for a 6.7% advance in the third quarter and a 2024 gain of 19.1%. The global benchmark rose 1.5% in euros over the month. The STOXX® Global 1800 index added 1.9% in dollars in September and 6.8% in the third quarter.
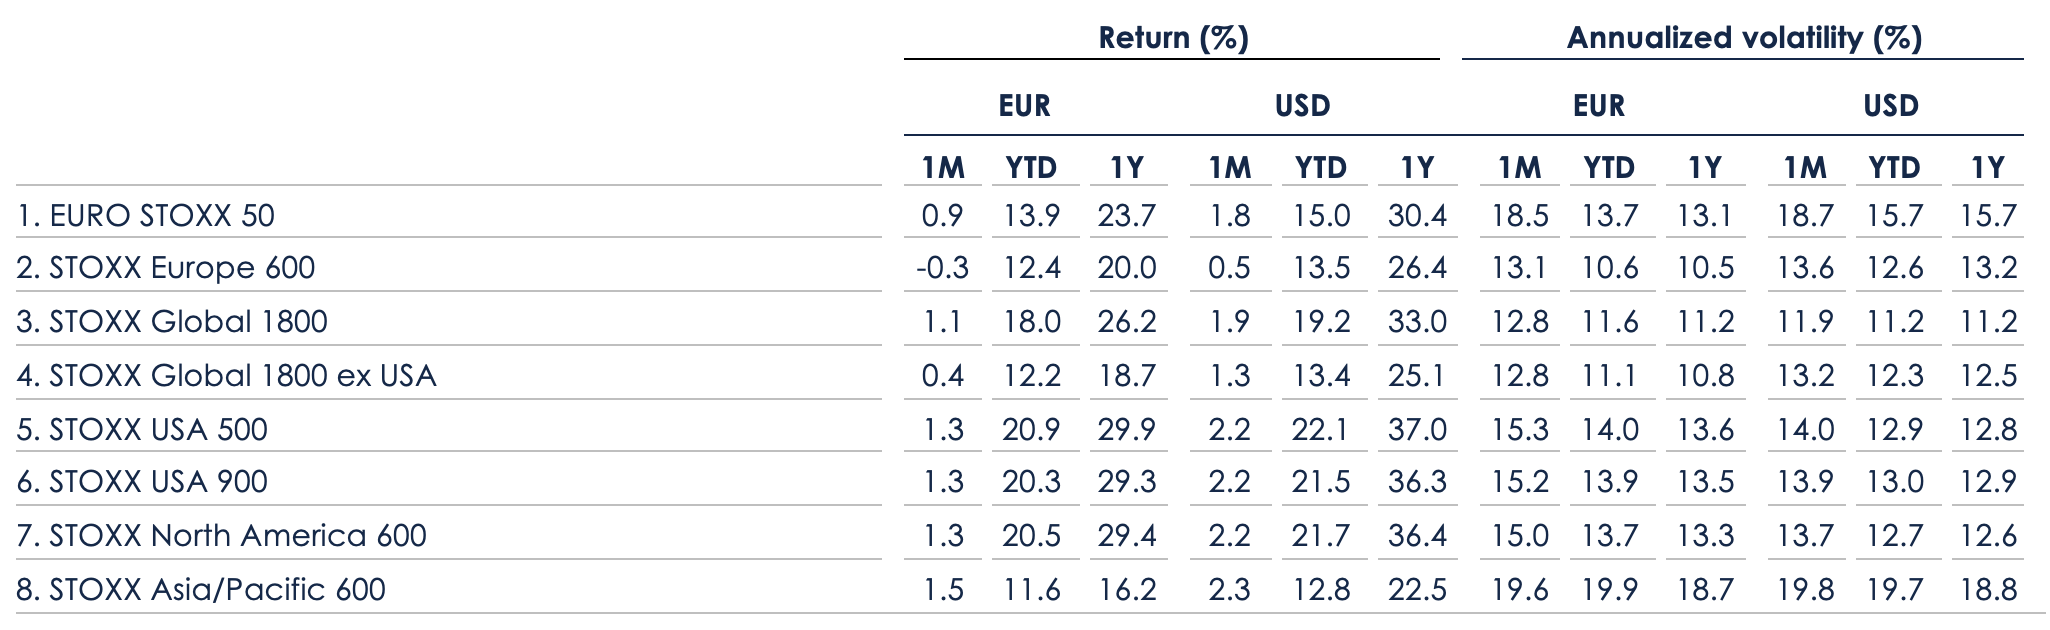
European stocks had more diverse performances over the month. The Eurozone’s EURO STOXX 50® rose 0.9% in euros on a total-return basis, while the pan-European STOXX® Europe 600 fell 0.3%,[2] dragged lower by its largest constituent, Novo Nordisk.
The STOXX® North America 600 rose 2.2% in dollars, as did the STOXX® USA 500, its tenth advance in eleven months. The STOXX® Asia/Pacific 600 climbed 2.3% in dollars. The STOXX® Developed World rose 1.9%, and the STOXX® Emerging Markets gained 6.4%, lifted by Chinese stocks.
Figure 1: STOXX Equity World indices’ September risk and return
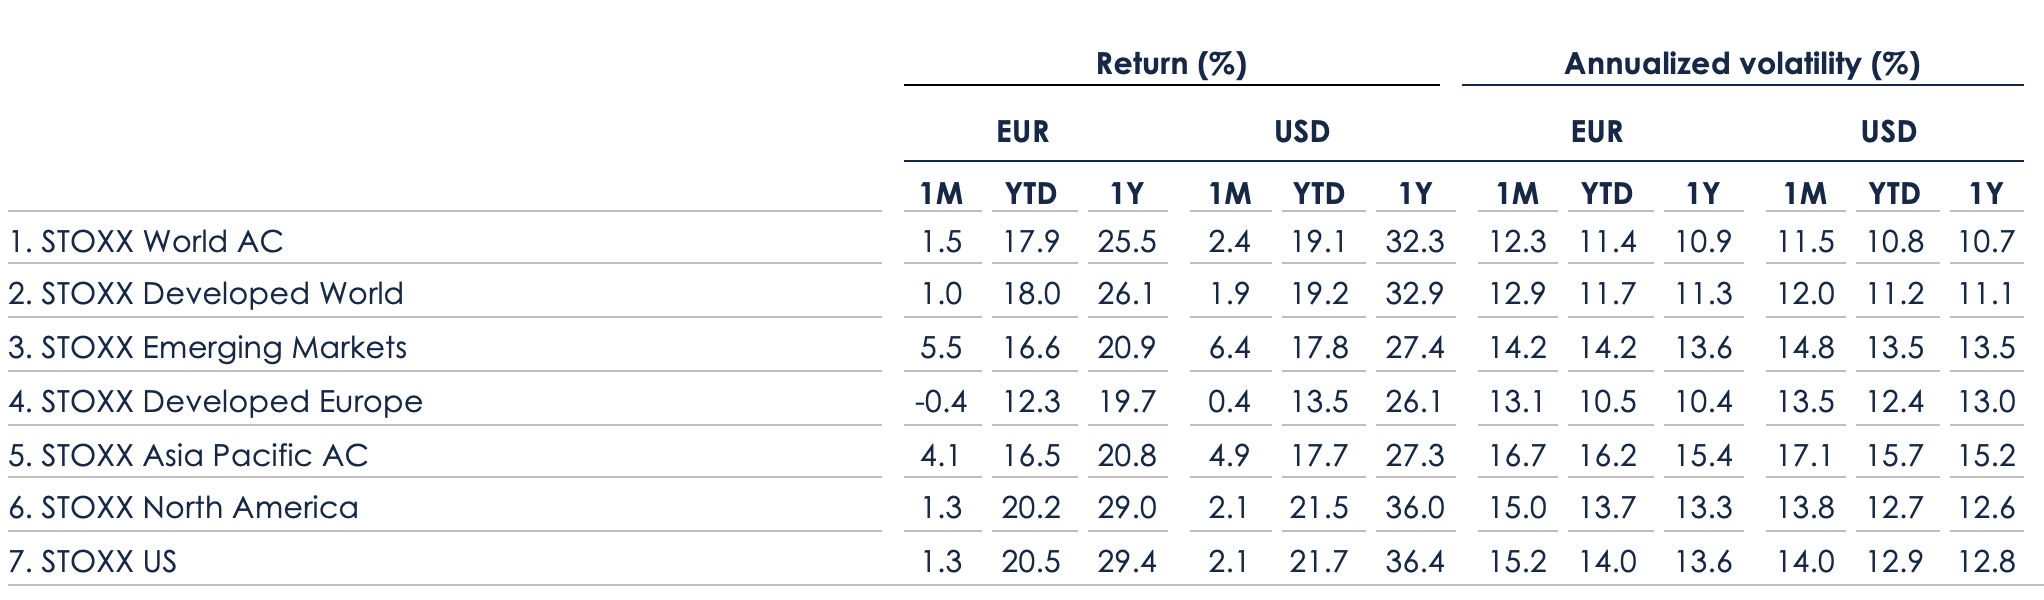
Figure 2: STOXX Benchmark indices’ September risk and return
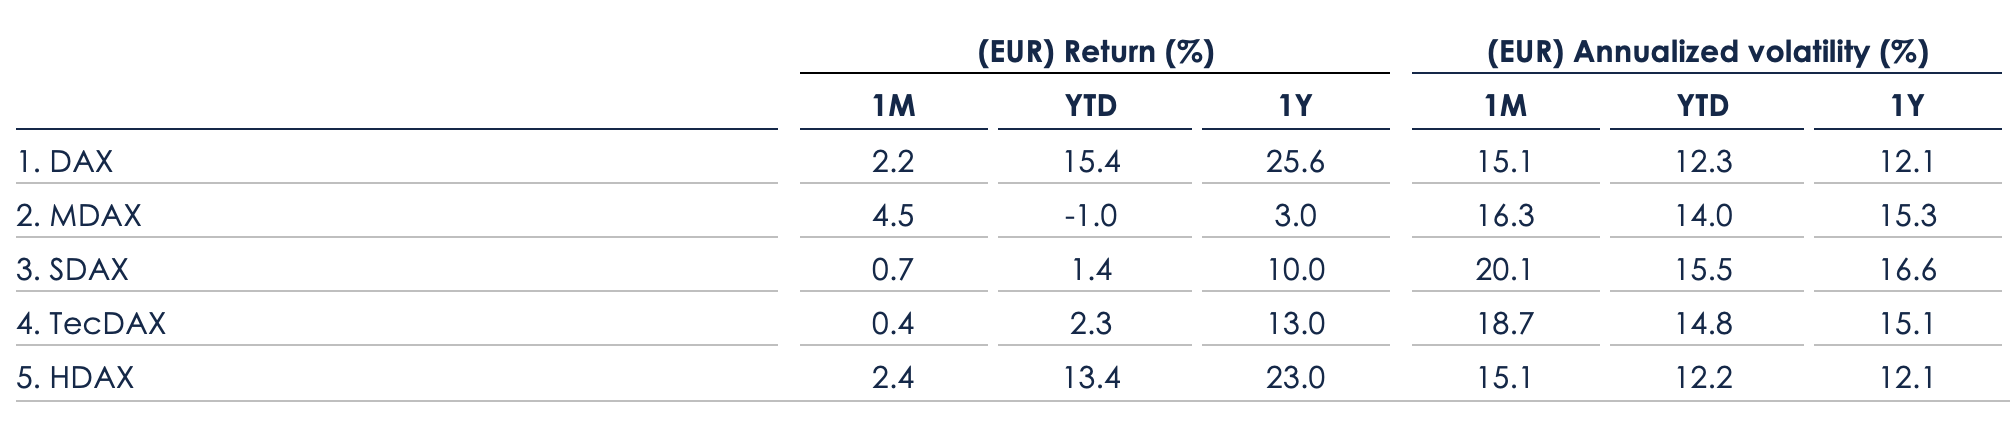
Germany’s DAX® increased 2.2% in the month. MDAX®, which gauges the performance of German mid-caps, climbed 4.5%.
Figure 3: DAX indices’ September risk and return
| For a complete review of all indices’ performance last month, visit our September index newsletter. |
Banks lower borrowing costs
As inflation has come down, the US central bank on September 18 lowered the benchmark federal funds rate by half a percentage point to a 4.75%-5% range, a larger cut than many had predicted. Fed Funds futures prices show nearly half of investors and traders expect the Fed to cut the key rate to 4%-4.25% by December.[3]
The European Central Bank reduced its key rate in June for the first time since 2016, and again in September. The Bank of England reduced the official Bank Rate in August.
Figure 4: Total annual % returns for STOXX World AC index
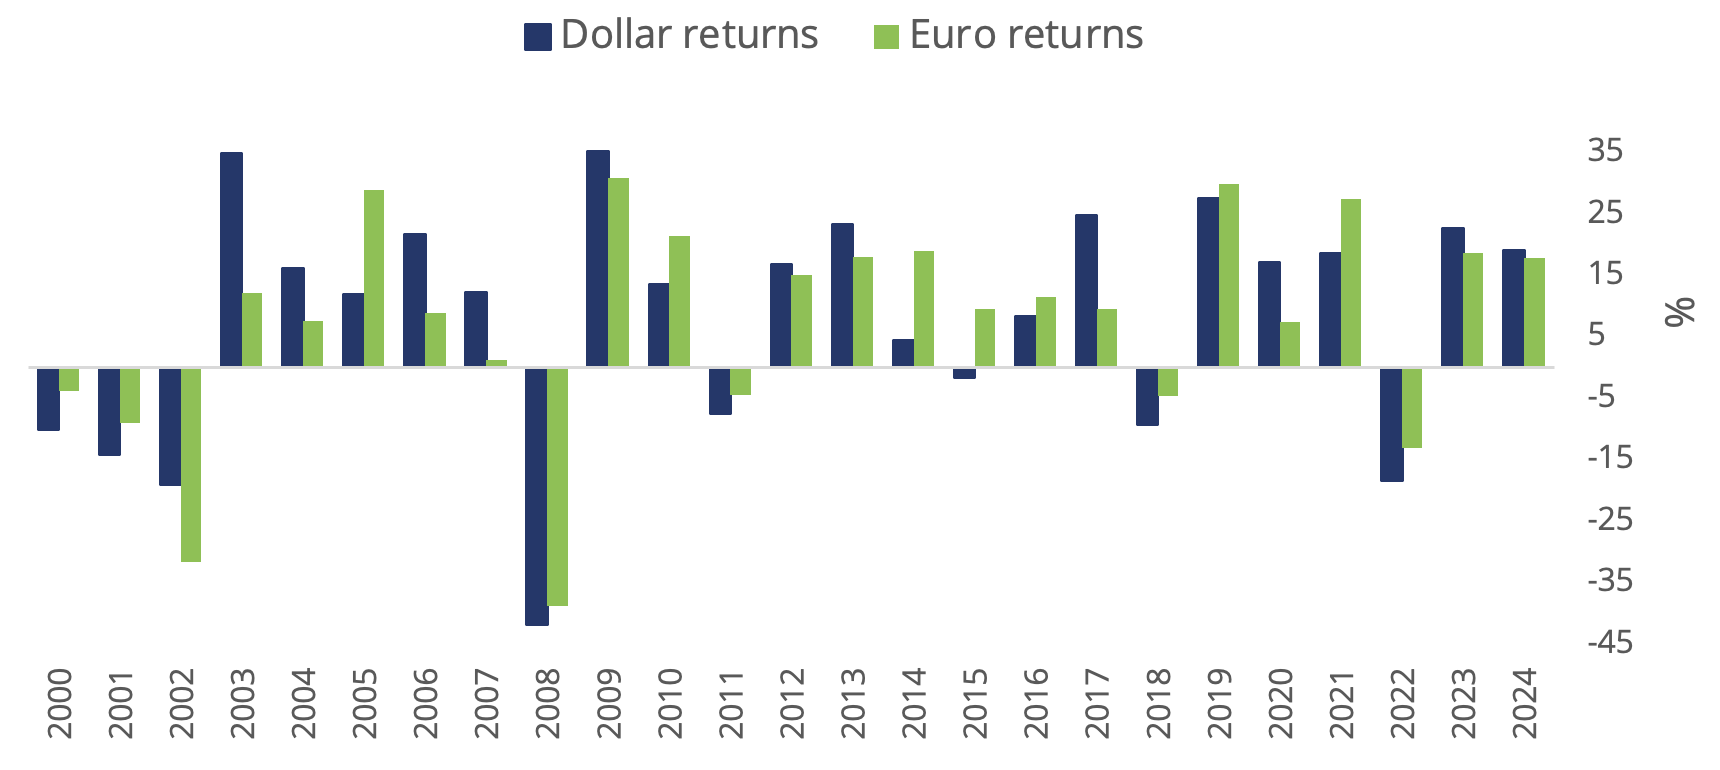
Figure 5: Select STOXX benchmarks’ returns since 2023
Volatility rises
Despite the positive market backdrop, the EURO STOXX 50® Volatility (VSTOXX®), which tracks EURO STOXX 50 options prices, rose to 18.1 at the end of last month from 15.3 at the end of August. A higher VSTOXX reading suggests investors are paying up for puts that offer insurance against stock price drops. The VDAX-New®, which measures volatility in German equities, rose to 16.5 from 14.3 in August.
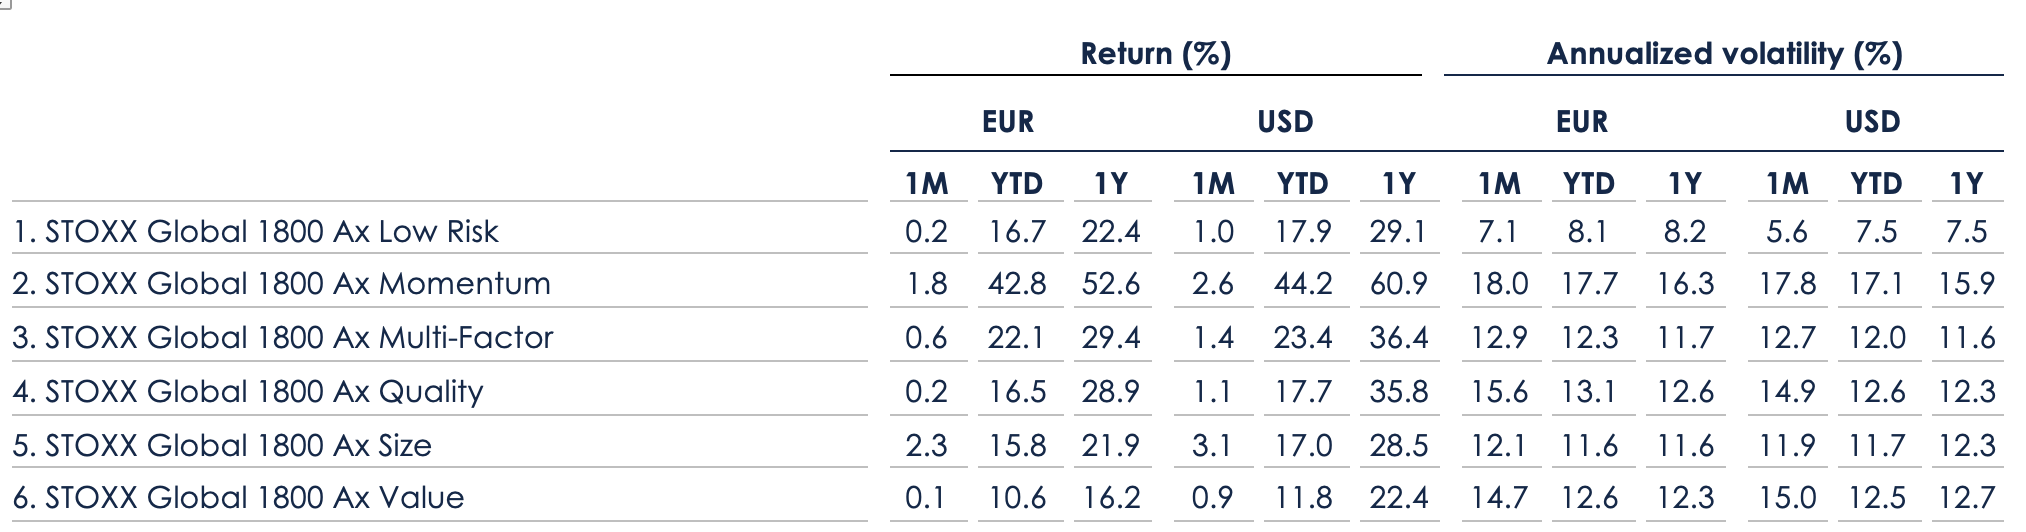
Factor investing
Among the STOXX Factor indices, the Size signal led gains last month, while Low Risk trailed (Figure 6).
Figure 6: STOXX Factor (Global) indices’ September risk and return characteristics
Climate benchmarks
Within climate benchmarks, the STOXX® Global 1800 Paris-Aligned Benchmark (PAB) rose 1.8% and the STOXX® Global 1800 Climate Transition Benchmark (CTB) gained 1.6%. The PAB and CTB indices follow the requirements outlined by the European Commission’s climate benchmarks regulation.
Sustainability indices
The STOXX® Global 1800 ESG-X index advanced 2% in the month. The STOXX® ESG-X indices are versions of traditional, market-capitalization-weighted benchmarks that observe standard responsible exclusions.
Within indices that combine exclusions and best-in-class ESG integration, the EURO STOXX 50® ESG index gained 0.8% over the month. Germany’s DAX® 50 ESG index (+2.6%)[4], which excludes companies involved in controversial activities and integrates ESG scoring into stock selection, beat the benchmark DAX in the month.
The STOXX® Global 1800 SRI rose 1.8%. The STOXX SRI indices apply a set of carbon emission intensity, compliance and involvement screens, and track the best ESG performers in each industry group within a selection of STOXX benchmarks.
Finally, the DAX® ESG Screened added 3% in the month. The index reflects the composition of the DAX benchmark minus companies that fail to pass norms-based and controversial weapons screenings, meet minimum ESG ratings or are involved in certain business activities considered undesirable from a responsible investing perspective.
Thematics, digital assets
Twenty-five of 36 STOXX® Thematic indices outperformed the benchmark STOXX Global 1800 last month. The STOXX® Global Lithium Miners and Producers index (17.9%) showed the biggest gain, while the STOXX®Global Silver Economy index (-0.9%) led losses.
The STOXX® Digital Asset Blue Chip index, which aims to track high-quality assets that represent the crypto universe today, rose 8.9% in the month.
Dividend strategies
Dividend strategies performed strongly in the month that ended. The STOXX® Global Maximum Dividend 40 (+2.5% on a net basis) selects only the highest-yielding stocks. The STOXX® Global Select Dividend 100 (+4%) tracks companies with sizeable dividends but also applies a quality filter such as a history of stable payments.
Minimum variance
Minimum variance strategies, on the other hand, had a weak month relative to benchmarks. The STOXX® Global 1800 Minimum Variance rose 1.2% and the STOXX® Global 1800 Minimum Variance Unconstrained climbed 1.1%.
The STOXX Minimum Variance Indices come in two versions. A constrained version has similar exposure to its market capitalization-weighted benchmark but with lower risk. The unconstrained version, on the other hand, has more freedom to fulfill its minimum variance mandate within the same universe of stocks.
[1] All results are total returns before taxes unless specified.
[2] Throughout the article, all European indices are quoted in euros, while global, North America, US, Japan and Asia/Pacific indices are in US dollars.
[3] Source: CME Group. Data as of September 30, 2024.
[4] Figures in parentheses show last month’s gross returns.