
Authors:
Mert Candar, Associate Vice President, Product Index Innovation, STOXX
Anthony A. Renshaw, Director, Product Index Innovation, STOXX
Yurong Gu, Vice President, Product Index Innovation, STOXX
Andrew Ang, Co-Founder Tau Balance and Adjunct Professor, Columbia University
The old adage is that history doesn’t repeat, but it rhymes. And that applies to markets too.
We can identify past market periods most similar to today, and measure how factor returns evolved during those periods, to inform our view of what factors may do next.
Factor premia aren’t constant. Leadership rotates across Momentum, Quality and Value styles as market conditions change, and a static multifactor mix may miss those rotations. The iSTOXX Ang Research Enhanced index family addresses this with timing models that tilt factor weights towards styles most likely to outperform in the prevailing environment. One of these is a local logistic regression model, which places more weight on more similar historical market periods in the past.
What makes a period in the past similar to today?
We describe the market by looking at how the market itself, sectors and factors were doing, and how these parts were moving relative to each other in terms of volatilities, short-term and long-term trends, correlations, concentration and dispersion measures. We also consider how much of that movement was market-wide rather than specific to isolated corners. This gives us more than a hundred numbers every month.
That count is too high, especially when some of those numbers say the same thing — like when most portfolios are trending up or down, or most parts of the market become volatile at once. So we compress these figures into five summary numbers at every point in history.
Similarity is then defined to be a distance between each set of five summary statistics. Two similar months show comparable volatility and dispersion, and a close resemblance between market-wide and sector-specific movements.
Turning similarity into a forecast
The model forecasts the probability that a factor beats the parent index, the STOXX® US Universal index, over the next three months. This is done separately for all factors: Cyclical Value, Enhanced Value, Quality and Momentum. Forecasting the probability of outperformance makes the output intuitive to interpret and easy to combine with other timing inputs.
Each past month is weighted by how similar it is to today — technically, distances converted to weights via a Gaussian kernel. The most similar months carry the greatest weights when we estimate the forecasting relationship. This is what makes our model “local.” Ordinary regressions, by contrast, treat every past month the same, regardless of how similar or dissimilar it is to today.
What the model sees now
At the end of August 2026, the three most similar months to the present were July 2015, December 2021 and January 2023 (Figure 1). Each carry a weight close to 1, meaning those periods count as much as a full observation in the forecasting model.
These periods appear, at first glance, quite different among themselves — one during the mid-2010s market expansion, another during the post-pandemic recovery, and the last one at the start of the 2023 rebound. But they share a common market structure: equities were advancing in a non-crisis environment, volatility was moderate, market leadership was evolving and investors were reassessing the path of monetary policy.
Other periods count for almost nothing: March 2020, at the onset of COVID-19, and January 2012, when the effects of the global financial and Eurozone sovereign debt crises were still present. This makes intuitive sense — these were unique episodes that don’t resemble today’s environment.
Figure 1: Three most similar historical market states for August 2026
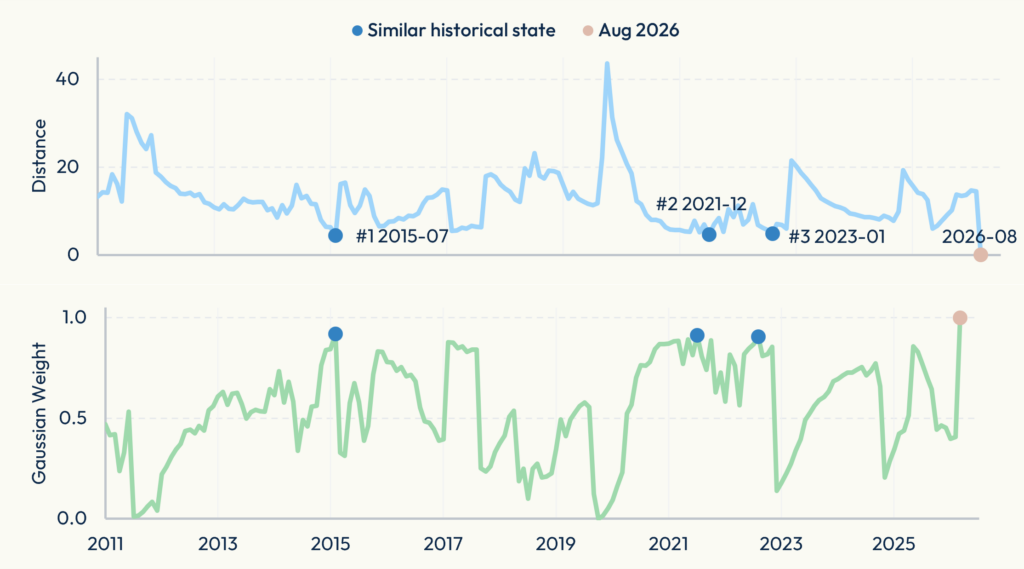
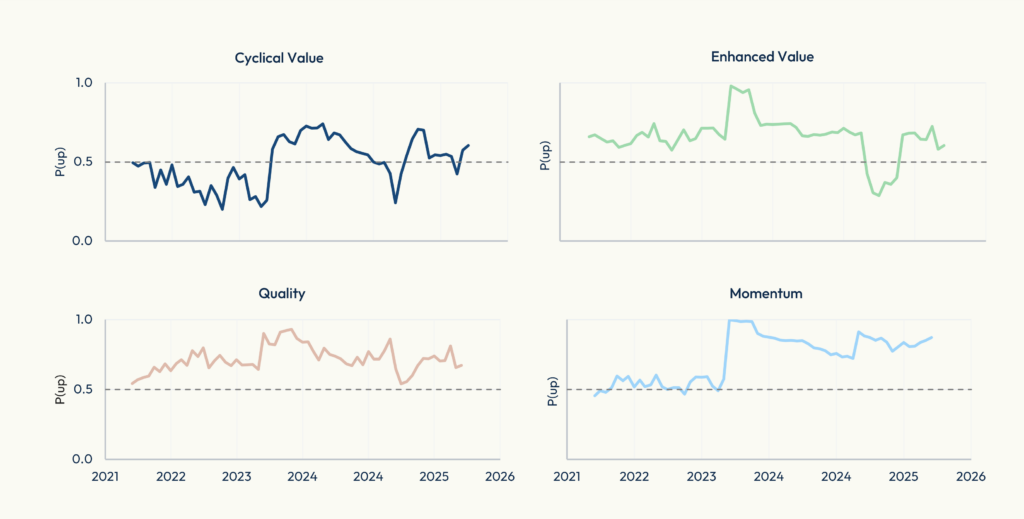
Figure 2 shows the probability of each of the four factors outperforming the market over three months’ time, for each month in the last five years. As the model seeks to identify shifts in market conditions, its expectation for outperformance constantly changes. While predictions for Value factors are more of a mix, they are mostly positive for Momentum and Quality.
Figure 2: Last five years probability history
Does it work?
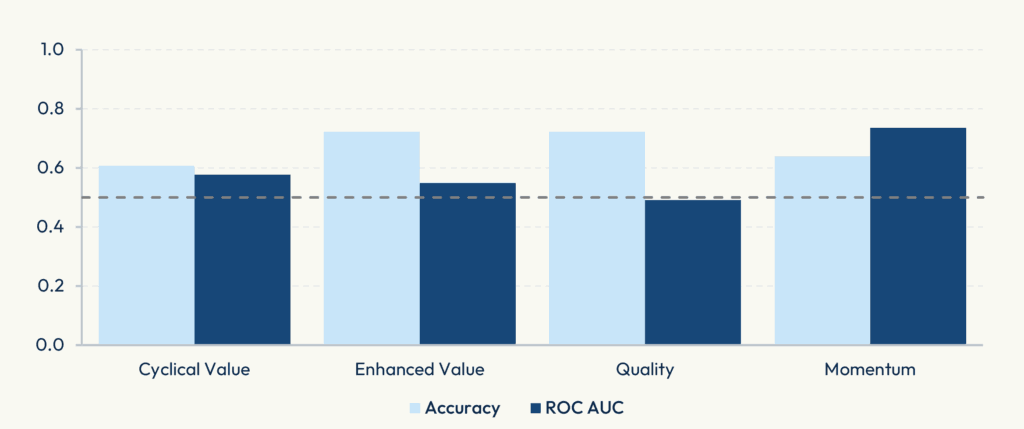
Forecasting returns is always hard. We’re seeking a slight edge, since it’s impossible to always get it right. We can assess the model’s accuracy as the share of quarters in which it got the direction right in Figure 3. To interpret ROC AUC[1], take one period where a factor outperformed and one where it didn’t: the AUC is the probability the model scored the first outperforming period higher. Guessing scores 0.5.
Across the four factors, the model’s overall accuracy is above 50%, with some results reaching approximately 70%. However, the outperformance is not uniform. Momentum is the most predictable factor from past market conditions, with an AUC of 0.74. Quality, on the other hand, is the hardest, at 0.49 — no better than guessing. The two value sleeves sit in between. Quality also shows why accuracy alone can be misleading. It has the joint-highest accuracy, 72%, and the lowest AUC. Quality outperformed in most quarters of our sample (the model usually forecasts that it would) but it’s not due to finding similar past market conditions.
Figure 3: Last five years accuracy and AUC
History’s rhyme gives us a slight advantage in forecasting factor performance. We build a model that measures how closely today’s market resembles the past, then use that information to sharpen our forecasts. Because we don’t want to rely only on historical similarity patterns alone, we also apply other timing models built on different information — including Factor Momentum and Factor of Factors. This diversifies our factor exposure tilts across timing models, in the same way the factor index itself is diversified across factors.
[1] ROC AUC: Receiver Operating Characteristic Area Under the Curve.