
On October 29, 2001, UBS Asset Management launched its ETF business with a fund tracking the EURO STOXX 50® index. That fund has grown to nearly EUR 800 million in assets through market gains and investor inflows.
The launch of the UBS EURO STOXX 50 ETF also marked the start of a longstanding partnership between UBS and STOXX[1]. As we celebrate the fund’s 25th anniversary, its benchmark offers a record of how the Eurozone’s largest listed companies have changed through market crises, shifts in industry leadership and evolving investor preferences.
Since inception in 1998, the EURO STOXX 50 has closely tracked the fate of the Eurozone’s blue chips, becoming the region’s undisputed market benchmark and one of the world’s most popular underlyings for ETFs, derivatives and structured products.
Today, more than EUR 57 billion is invested in ETFs linked to the EURO STOXX 50. Futures on the index were launched in June 1998, ahead of the introduction of the euro and monetary union. More than 320 million futures and options on the index changed hands on Eurex in the first nine months of 2026. Over 110,000 active structured products were linked to the benchmark as of June.
While the index’s core objective has remained unchanged since 1998, three major methodology changes were decided this month following a market consultation. Among them, the Supersector capping rule, under which EURO STOXX 50 constituents were selected along industry lines, will be dropped starting with the September 2029 review.
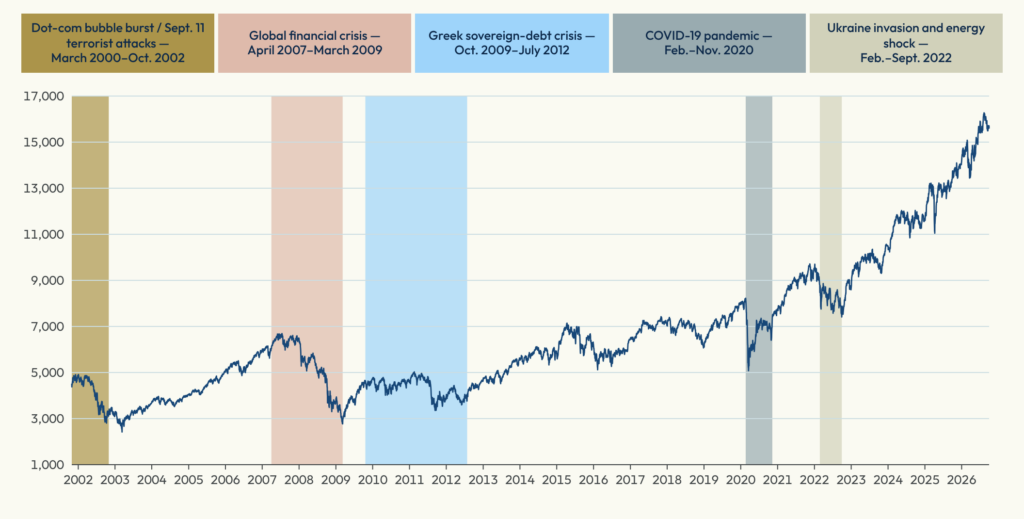
The EURO STOXX 50 has increased 243% on a net-return basis since the UBS ETF was launched on October 29, 2001, equivalent to an annualized return of 5.1%.[2] The index has weathered major market events along the way, including the global financial and European debt crises, and the war in Ukraine (Figure 1).
Figure 1: 25 years of market-moving events
“The EURO STOXX 50 has been the flagship benchmark for the European equities ecosystem: delta one and volatility instruments,” said Amanda Rebello, Global Head of ETF and Index Funds Client Coverage at UBS AM. “We are delighted to have launched an ETF on this key index 25 years ago and to have included it in our extended Core range this year.”
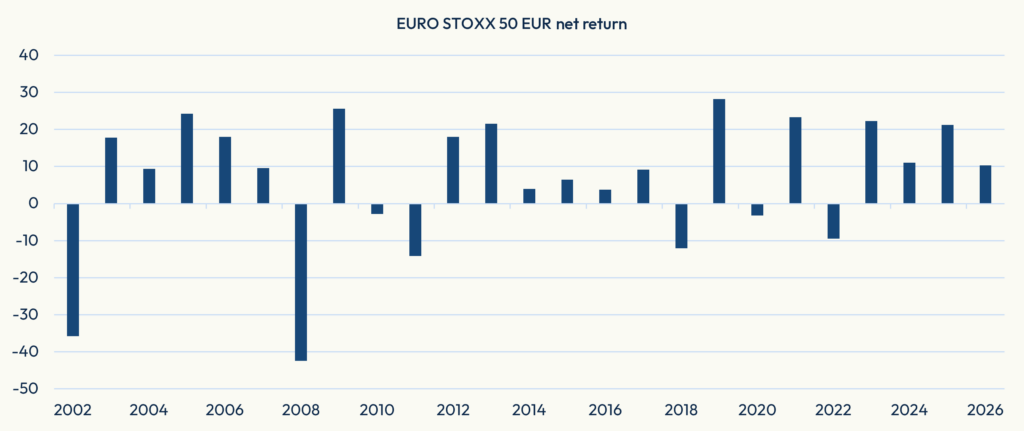
Figure 2 shows the annual net returns for the EURO STOXX 50 since 2002.
Figure 2: Annual returns
Diversified composition
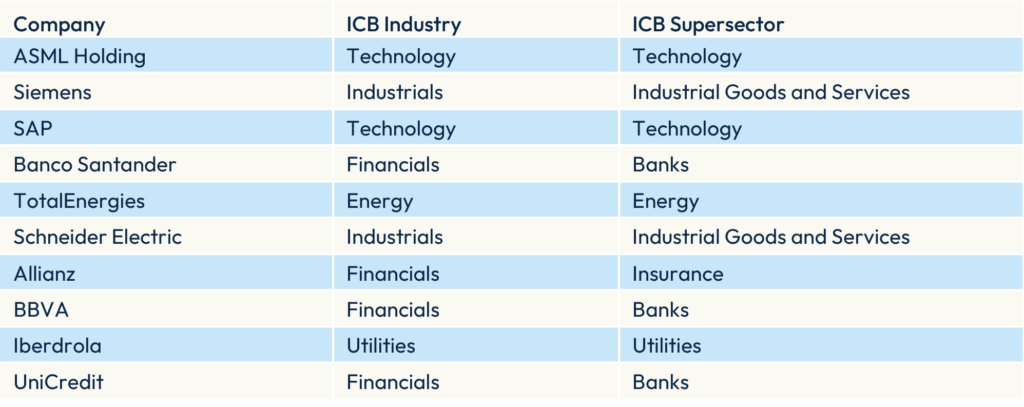
Figure 3 shows the current top ten constituents in the EURO STOXX 50, a diversified group stemming from five different ICB Industries and six ICB Supersectors.
Figure 3: Top ten holdings
Changing leaders
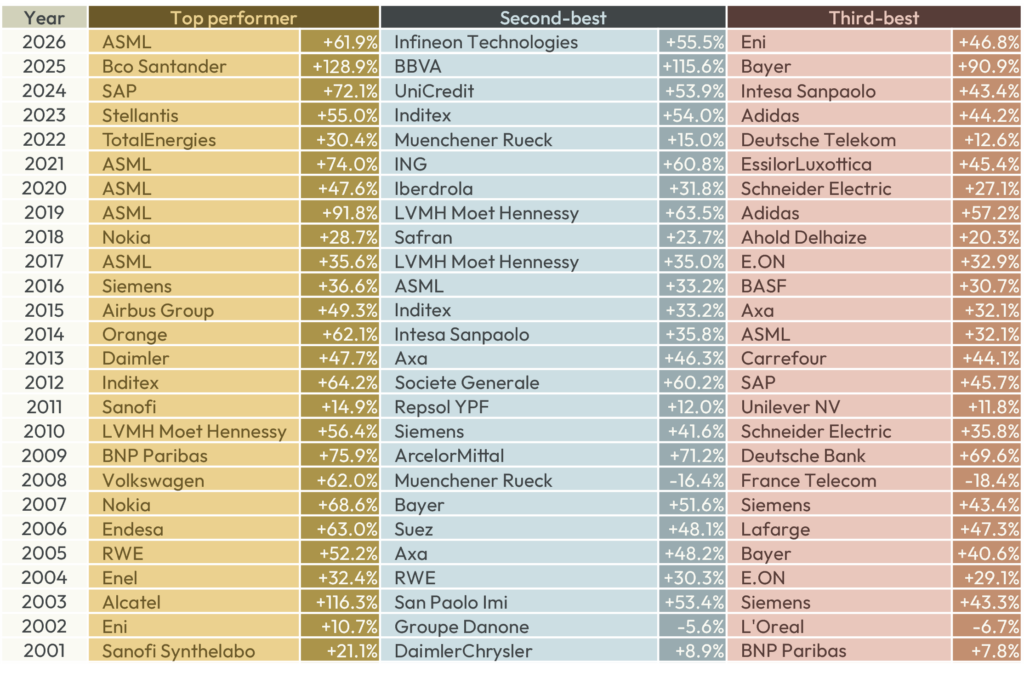
Figure 4 lists the three best-performing EURO STOXX 50 constituents in each year since 2001, based on price returns and including only companies that were members for the full calendar year. The changing names offer a snapshot of which business sectors led the market at different points in the index’s history.
Figure 4: Top performers by year
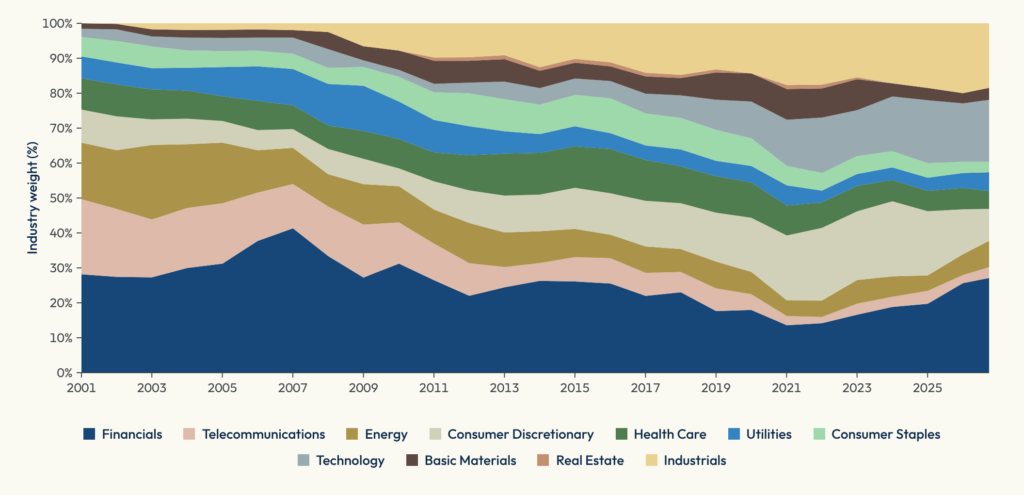
The longer-term sector momentum shift is visible in Figure 5, which shows the weight evolution of eleven ICB Industries in the EURO STOXX 50. A couple of trends stand out. First, Industrials and Technology have gained significant relevance since the start of the century, at the expense of Telecommunications and Energy. Second, Financials lost ground following the global financial and Eurozone debt crises, although that trend has reversed in the past five years.
Figure 5: Industry allocations
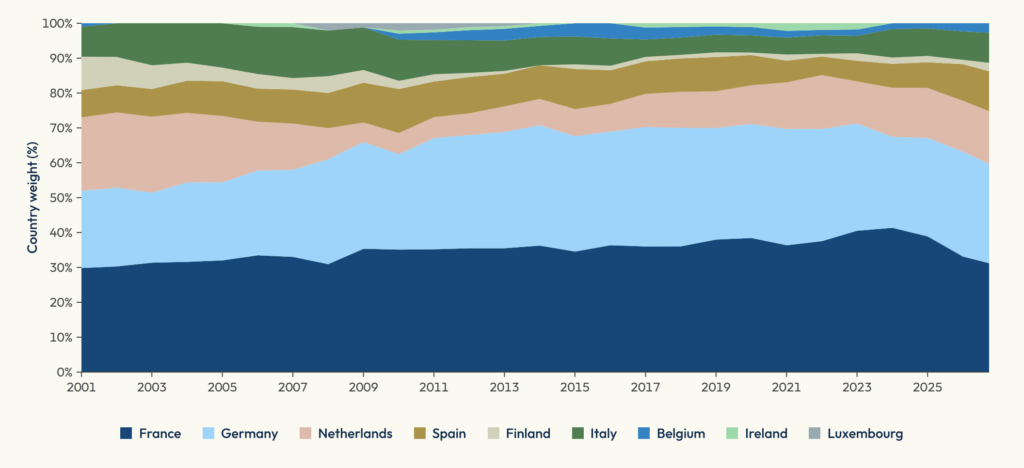
Country allocations, on the other hand, have been more stable (Figure 6). French and German companies have accounted for the largest shares in the index throughout the period, alongside substantial representation from the Netherlands, Spain and Italy. As of September 2026, there were seven Eurozone countries represented in the benchmark.
Figure 6: Country allocations
Valuations
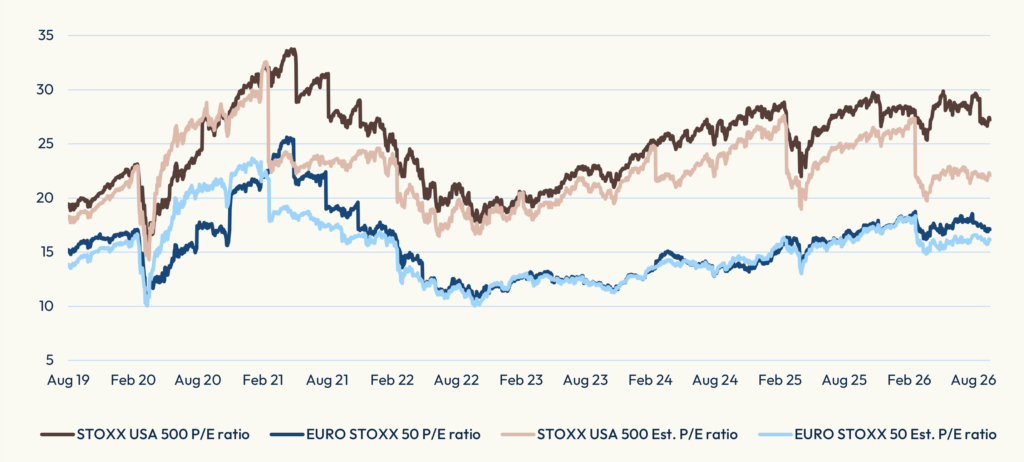
Low valuations relative to other regions have been a defining feature of Eurozone equities for a large part of the past 25 years. Figure 7 shows the historical trailing and estimated price-to-earnings multiples of the EURO STOXX 50 and the STOXX® USA 500 indices since August 2019. On current earnings, the European gauge has traded at an average discount of 37% to the US index over the period, with the gap widening in recent years given the premium commanded by Technology large caps in the US.
Figure 7: P/E comparison
A benchmark with new applications
Today, the EURO STOXX 50 supports a broad family of derived indices. The most popular ones include the VSTOXX® index, which measures expected volatility implied by options on the benchmark, and the EURO STOXX 50® ESG, which applies sustainability exclusions and selection criteria. UBS launched the first ETF on the ESG index in July 2019. The fund has since attracted over EUR 4.2 billion in assets, more than five times the amount invested in the original UBS EURO STOXX 50 ETF.
Keeping the methodology relevant
Throughout this period of growth, the benchmark’s goal hasn’t changed: to provide a balanced representation of the Eurozone’s Supersector leaders and secure liquidity and transparency.
Between July and September 2026, STOXX consulted market participants on three proposed changes to the index methodology. These included removing the Supersector capping rule used in constituent selection, moving from an annual to a semi-annual review, and aligning fast exits with regular review and rebalance dates. The proposals sought to improve the index’s representation of the Eurozone market and its responsiveness to change.
Respondents broadly supported the removal of the Supersector capping rule, to allow companies with the highest free-float market capitalization to enter the index regardless of which sector they are in. This strengthens the alignment between the index and the actual Eurozone market composition while increasing transparency and simplicity for market participants. The other two changes were also approved.
Implementation of the three changes will be phased between September 2027 and September 2029.
Looking ahead
For nearly three decades, the EURO STOXX 50 has tracked the story of the Eurozone itself. The decision this year to move to a purely free-float-based selection, alongside a more responsive review cycle, is designed to keep the benchmark aligned with how the region’s largest companies trade, rather than how they are classified.
With the ascent of AI and rapidly changing consumer preferences, the Eurozone economy promises to look very different in the next 25 years. The EURO STOXX 50 will reflect those shifts and remain a liquid, rules-based and transparent instrument for investors seeking exposure to the region. We congratulate UBS Asset Management on the 25th anniversary of its EURO STOXX 50 ETF.
[1] STOXX is the administrator of the EURO STOXX 50.
[2] Data through September 18, 2026.