In the asset management world, the terms ‘value’ and ‘growth’ have long been used to describe two distinct investment styles, and many managers categorize themselves and their products along these two labels.
Value investors typically buy companies at prices that are inexpensive relative to fundamentals such as book value, earnings or cash flow. The idea is that undervalued companies will eventually bounce back once their true value is recognized by the market.
Growth investors, on the other hand, aim to identify companies that can expand their sales and earnings faster than the market’s average, and they expect the share price will follow in step.
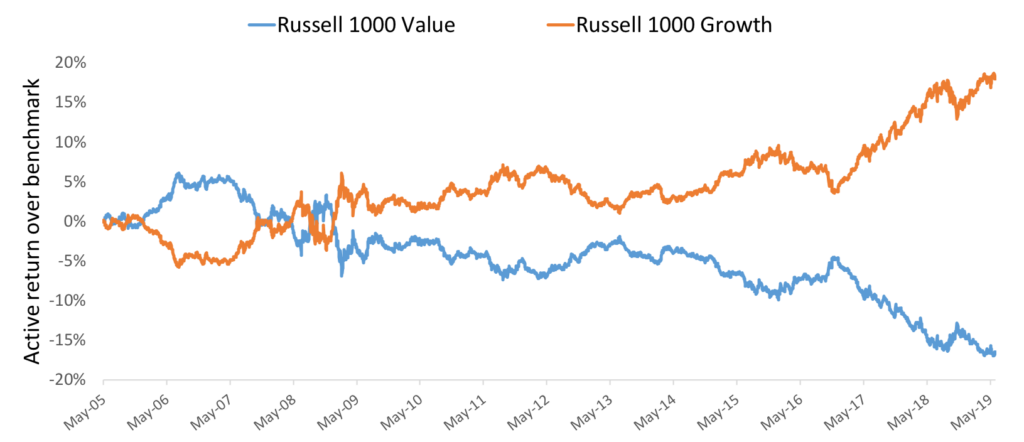
Even though this is not innate in the design of the two investment styles, traditional value and growth style indices usually perform like exact opposites, with respect to the overall market. This can be seen in Figure 1, which displays traditional value and growth indices by Russell.
Figure 1

As a result, it shouldn’t be surprising that a static equal-weighted combination of conventional value and growth strategies will deliver near-to-market returns. More on this later.
An enhanced approach to value and growth
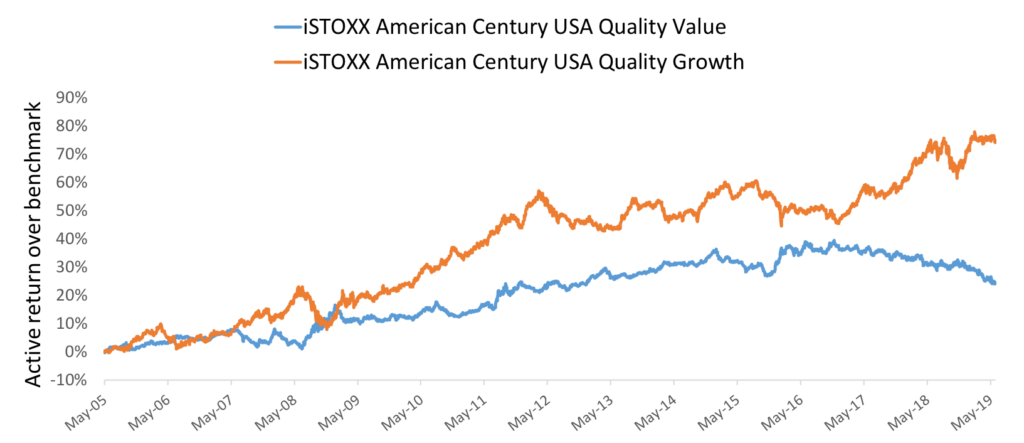
In response to this challenge, STOXX and American Century Investments developed a set of enhanced value and growth indices: the iSTOXX® American Century USA Quality Value Index and the iSTOXX® American Century USA Quality Growth Index.
While these two indices still follow the same investment rationale of conventional value and growth managers mentioned earlier, they are designed to outperform the market through a full value-growth cycle (Figure 2).
Figure 2

A number of particular features in the indices’ methodology serve this outperformance. Firstly, by limiting unintended systematic bets that derive from the traditional value and growth selection process, such as sector exposure, the indices can maximize the respective investment style premium. This results in indices that are pure-play strategies, as well as less correlated with each other.
In fact, the active return of both enhanced strategies versus the market can be attributed mostly to the targeted value and growth characteristics, in contrast to traditional value and growth indices that are to a large degree also driven by sector or other systematic bets. In the year through January 2019, for example, the return contribution from sector exposure in the iSTOXX American Century USA Quality Value Index was 0.7%, compared with -1.9% for the Russell 1000 Value Index.
Secondly, the iSTOXX American Century indices include quality screens that ensure that companies with a poor quality record in metris such as profitability, management leverage and earnings revisions are excluded. This helps offset or limit well-known problems of traditional value and growth indices, such as that of buying ‘value traps,’ but does not affect the style tilt. Similarly, for the iSTOXX American Century USA Quality Growth Index, the quality filter stabilizes the volatility of the growth style.
Dynamic allocation between two sub-strategies
Finally, the iSTOXX American Century USA Quality Value Index is composed of two sub-strategies: value (selection based on price relative to book, earnings and cash flow) and high dividend (highest and most consistent dividend payers with low leverage and low price volatility). The index dynamically shifts weight into the defensive high-income sub-strategy when value is out of favor, and vice versa, guided by a risk-adjusted momentum signal. The index can thus capture the upside in value while mitigating risk when value stocks languish.
The growth index similarly shifts between two sub-strategies: high, or pure, growth, and stable growth. This composition gives the index better protection from cyclical drawdowns, helping to generate stronger risk-adjusted returns in the long term.
Better building blocks for a combined diversified portfolio
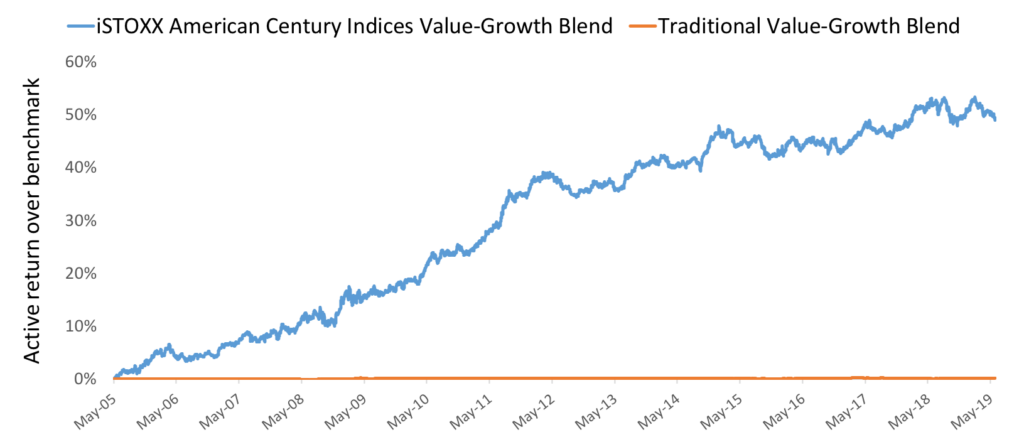
As a result of these enhancements, a simple combination of the iSTOXX American Century style indices may be a better investment strategy for buy-and-hold investors who want to benefit from an entire economic cycle, as shown in Figure 3. However, their pure-play character also makes them an attractive investment tool on their own.
Figure 3

The orange line in Figure 3 shows how inefficient a combined portfolio of traditional value and growth positions can be. The net active result was close to zero in the period analyzed, as each style canceled out the other’s outperformance. A more enhanced approach to portfolio construction can help leave this problem behind.
