This year, Qontigo expanded its comprehensive framework of STOXX sustainability index-based solutions to offer a varied and flexible toolbox for an asset-management industry quickly adopting ESG objectives. We reviewed this enlarged indices framework in an article on this blog last April.
The STOXX ESG index framework has been thought of as containing two categories, each one channeling a different level of sustainability penetration. We call these buckets ‘Exclude’ and ‘Enhance’, with the first one representing a starting point in responsible engagement and risk mitigation, and the second one offering further opportunities to optimize sustainable investing.
Figure 1 – STOXX’s two ESG buckets

The STOXX ESG Broad Market indices1 and the STOXX ESG Target/Target TE indices2 are two of three ESG index families introduced this year (in green in Figure 1). This post will focus on the third new family, the STOXX SRI (Socially Responsible Investing) indices.
ESG and climate industry leaders
The STOXX SRI Indices track the performance of a selection of established benchmarks after screens are applied for carbon emission intensity, compliance, business involvement and ESG performance. The indices were designed to track the best ESG performers within each industry after the highest carbon emitters are screened out, which leads to a slightly larger tracking error to benchmarks than that of other STOXX ESG indices.
Selection process
From the starting benchmark universe, the 10% highest-emitting stocks are excluded, as are companies that violate global norms and product involvement screens. These filters are in line with investors’ preferences and standards for enhanced screening, and currently include: Sustainalytics’ Global Standards Screening assessment, and involvement in controversial weapons, tobacco, alcohol, adult entertainment, gambling, small arms, military contracting, thermal coal, oil & gas and nuclear power.
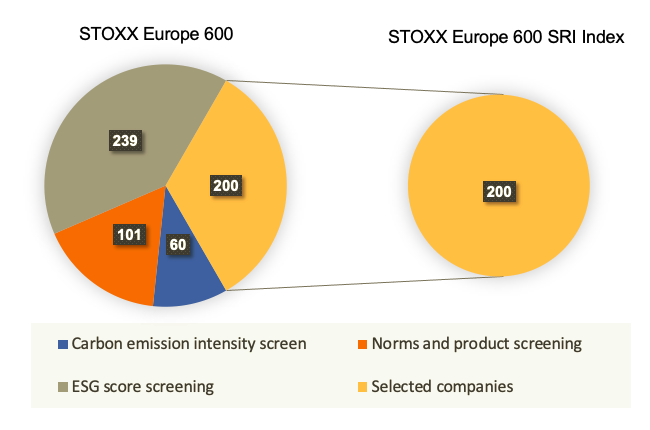
The remaining securities are ranked in descending order of their ESG scores within each of the 11 ICB Industry groups. The STOXX SRI Indices select the top-ranking securities in each industry until reaching a third of the number of securities in the starting universe.
Figure 2 shows the type of exclusions that led to the final 200 stocks in the STOXX® Europe 600 SRI Index, from the STOXX® Europe 600 Index.
Figure 2 – Number of stocks excluded from starting universe
Index profile analysis
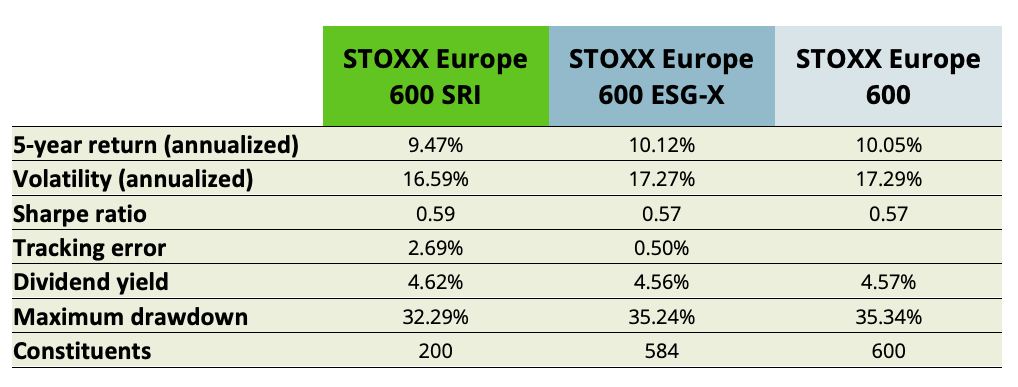
In terms of risk and return, the STOXX Europe 600 SRI Index has underperformed its benchmark slightly, as well as a version of the STOXX Europe 600 that only incorporates norms and products exclusions: the STOXX® Europe 600 ESG-X Index.3 The SRI index’s tracking error is larger than that of the ESG-X Index.
It’s worth noting, however, that the SRI index has shown to be the least volatile index among the three, both in terms of realized annualized volatility (as measured by standard deviation of daily returns) and maximum drawdown.
Figure 3 – Risk and return characteristics
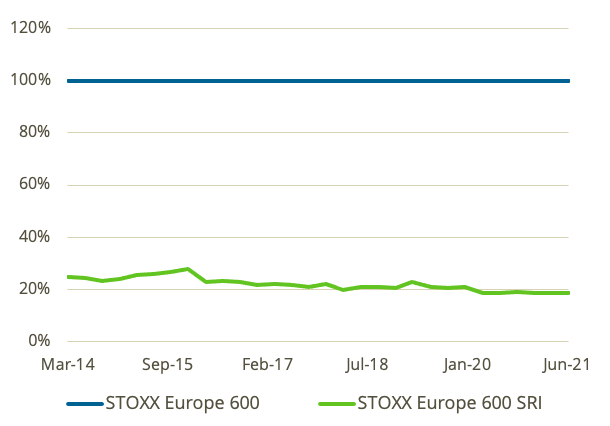
Turning now to the SRI indices’ by-design benefits, we look at the STOXX Europe 600 SRI’s record in lowering the portfolio’s carbon emissions and improving the ESG profile. In effect, Figures 4 and 5 show that these objectives were largely accomplished by the index methodology. In the period analyzed, the SRI index improved the final portfolio’s ESG score by more than five points (maximum level in the Sustainalytics risk rating scale is 100). More noticeably, the total carbon emission was cut by over 80%.
The STOXX SRI indices use Scope 1 and Scope 2 emission intensity data from ISS ESG.
Figure 4 – ESG performance
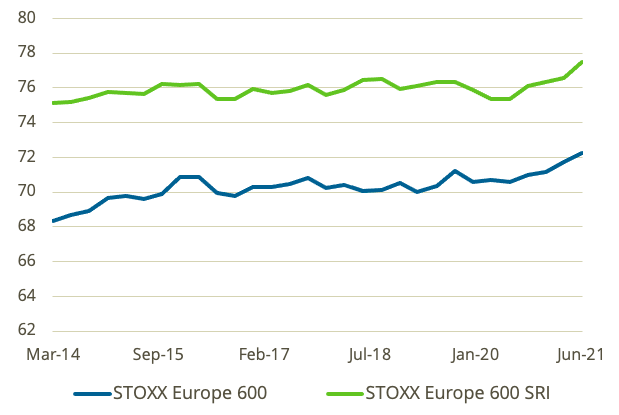
Figure 5 – Emission intensity
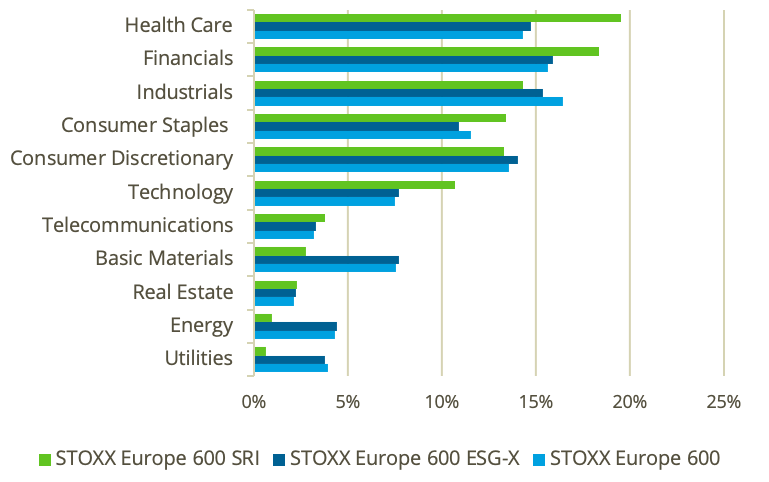
Lastly, Figure 6 shows that while the SRI index follows an industry-based selection process, there exist sector allocation differences in relation to the benchmark and the STOXX Europe 600 ESG-X. As of June this year, health care, financials, consumer staples and technology were overweighted in the SRI index. Energy and utilities were heavily underweighted as a result of the product-involvement screens in thermal coal, oil & gas and nuclear power.
Figure 6 – Industry allocation
A rules-based approach to every objective
The SRI indices offer a specific alternative for a targeted ESG and climate strategy, and respond to Qontigo’s belief that an efficient ESG framework must be flexible to meet each individual investor’s ambition and level of sustainability commitment. The indices also offer access to the best-in-breed data from Sustainalytics and ISS ESG, allowing investors to incorporate the leading ESG information in the market.
Explore in detail each one of the seven SRI indices.
1 The STOXX ESG Broad Market Indices track the performance of a selection of STOXX indices after a set of compliance, involvement and ESG performance screens are applied.
2 The ESG Target Indices aim to reflect the benchmark’s performance and, at the same time, maximize the portfolio’s ESG score. The weighting of each constituent security is determined through an optimization process that ensures diversification and relies on Axioma’s risk modelling for tracking error calibration. The ESG Target TE Indices use a similar configuration, but have the objective of minimizing tracking error.
3 The norm- and product-based screenings of the ESG-X Indices exclude companies that are non-compliant with Sustainalytics’ Global Standards Screening, or are involved in controversial weapons, tobacco, or thermal coal production or consumption.
