With ESG funds available to investors becoming as plentiful as they are diverse, how do they stack up when it comes to improving a portfolio’s sustainability metrics? How do they achieve those metrics, and how much active risk do they take on?
A new whitepaper1 from Qontigo looks into 37 ETFs with an ESG/sustainability/carbon reduction remit and runs them through a thorough analysis to go beyond their name and establish how their exposures to several sustainability-related factors vary. The study also examines how funds attain the various ESG goals in terms of sector/asset allocation and active risk, and what levels of exposures to ESG metrics are possible for a given level of tracking error and industry divestment.
Authors Rob Stubbs and Melissa Brown2 rely on Qontigo’s open architecture platform to obtain a wide range of sustainability factors from ISS ESG, Sustainalytics, Clarity AI and the SDI AOP.
Each ETF was evaluated according to 17 variables covering ESG scores, exposure to the UN’s Sustainable Development Goals (SDGs) and carbon metrics. Within the latter, the information considered included carbon risk ratings, total emissions intensity and progress toward the Science-Based Targets initiative objectives (SBTis).
Some key findings in the whitepaper are:
Most ESG ETFs looked good on a variety of metrics (in other words, there was no glaring evidence of greenwashing)
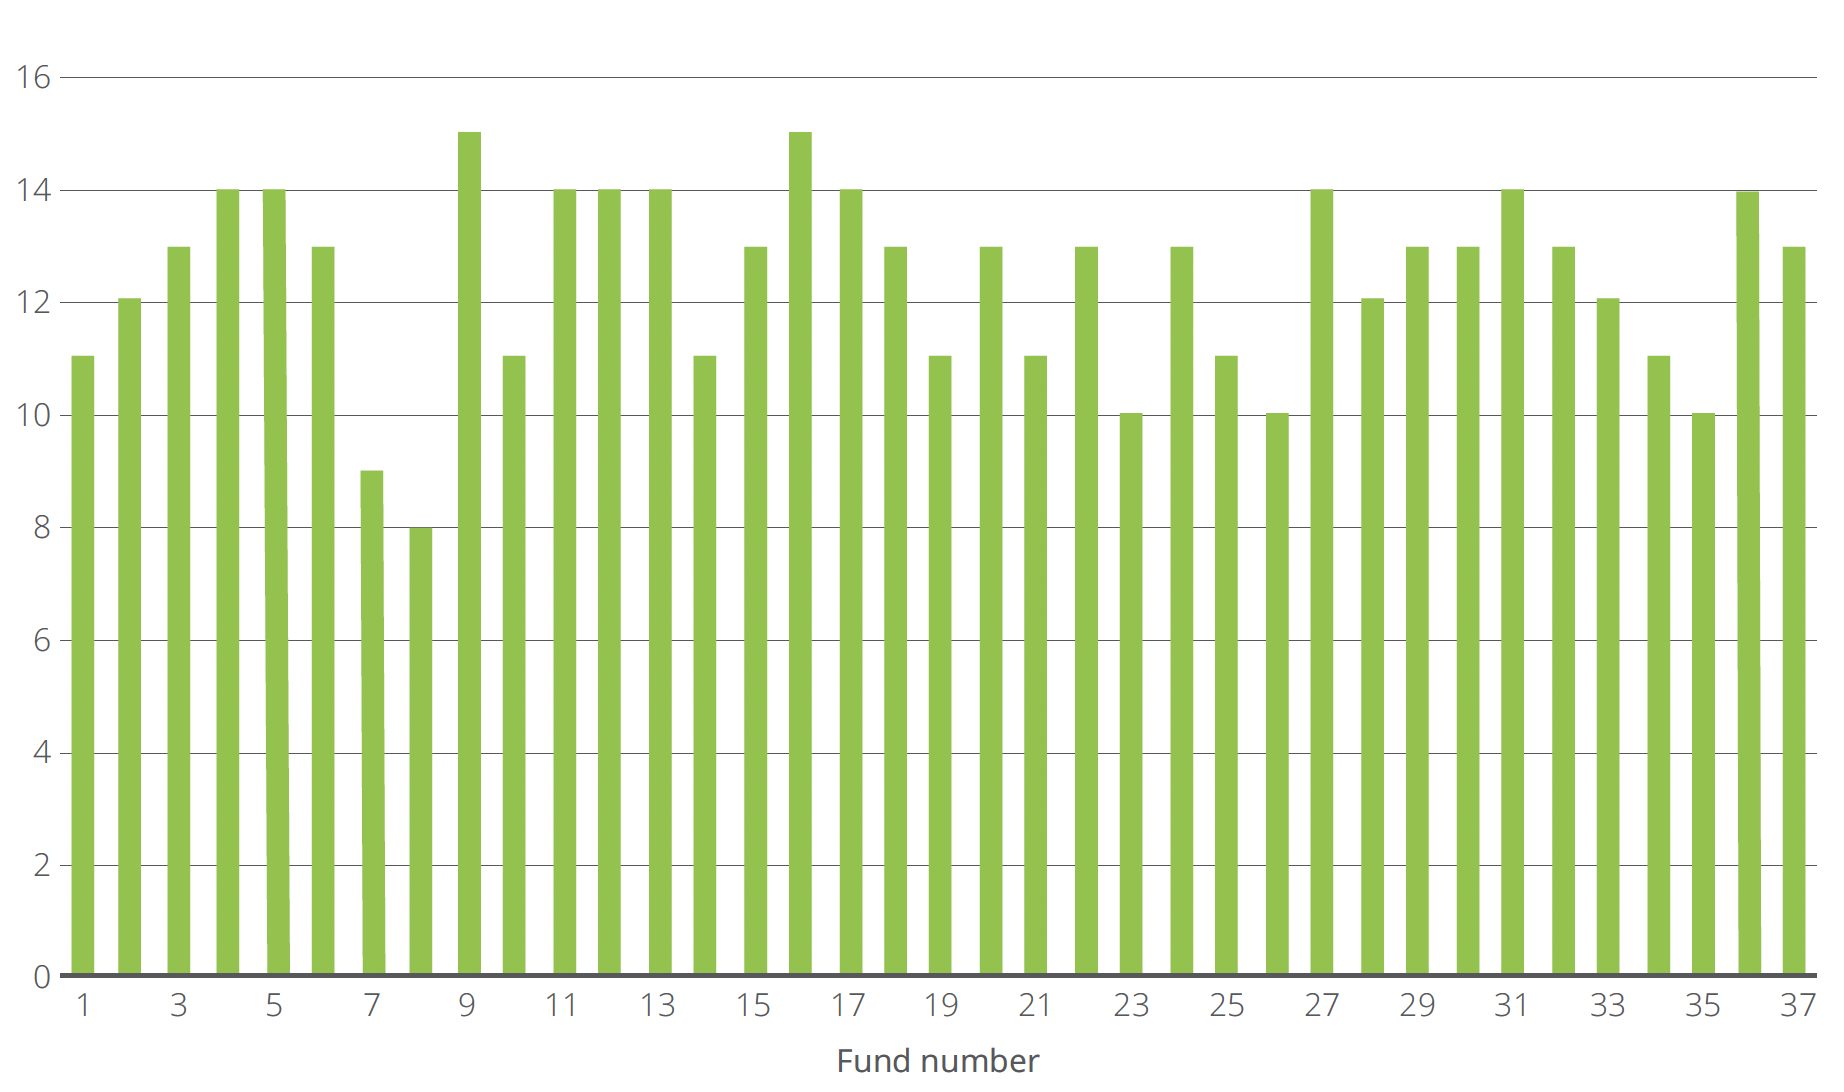
All funds ranked better than their benchmark on at least eight out of the 17 metrics (Exhibit 1). On average, each fund outperformed on 12 metrics.
Exhibit 1 – Number of ‘good’ metrics

“Despite the accusations of greenwashing leveled at the industry, we were pleased to see that most funds looked good on a variety of metrics, even where these were probably not their primary goal,” the authors write. “This was particularly true for exposures to the Sustainable Development Goals, which are highly unlikely to have been part of the stock selection process but were generally positive.”
Many funds achieved their scores by eliminating complete industries or sectors rather than by selecting specific companies within them
This can be a sticking point in many ESG strategies, as the underweight of ‘brown’ sectors may curtail the long-term sustainability progress of the fund and increase tracking error. In addition, a purely sector-elimination approach discourages investments in companies trying to improve their sustainability records vis-à-vis their industry and may reduce the potential for engagement with management on sustainability issues.
The analysis shows that many funds lowered their carbon emission by eliminating entire industries. In some cases, the managers kept a balanced industry exposure but fully divested from a sub-group (for example, selling the whole Electric Utilities segment within Utilities). In a metric like the ESG score, the improvement was found to be more equally distributed between the industry selection effect and the stock-picking effect (under/overweighting specific stocks within a sector or industry).
“We believe that excluding entire sectors has a number of drawbacks in the long run,” Rob and Melissa write. “These include making further portfolio improvement difficult, generating higher risk and perhaps most importantly failing to reward companies that are trying to do better even though they are in ‘brown’ industries.”
Optimization can provide balanced exposure to several metrics, with lower risk and better diversification
Finally, the researchers ran 18 point-in-time optimizations on the funds to determine whether using an optimizer to trade off risk versus sustainability exposure can yield a more efficient portfolio. They also measured the impact of tracking error and industry constraints on the ability to achieve a more sustainable investment strategy.
The ability to produce better active exposure to the ESG Score and the ESG Risk Score metrics increases as the portfolio goes up the tracking error scale, the study showed. A portfolio with 200 basis points of tracking error, regardless of industry constraints, has about twice the exposure to the ESG Score of a 50-basis point portfolio, and more than three times the exposure to the ESG Risk Score. Loosening the industry constraint seems to have little impact on either ESG score.
Loosening industry constraints, along with higher levels of tracking error, resulted in better SDG scores at each level of tracking error, especially at the highest level tested.
Finally, while looser industry constraints improved the Carbon Risk Rating and Emissions intensity, higher tracking error did not necessarily lead to better exposure compared with lower tracking error. In other words, higher tracking error with tight industry constraints did not lead to a more sustainable portfolio.
“We demonstrated that we can offer a better approach by considering many different dimensions of sustainability and using optimization to achieve the most efficient trade-off between sustainability and risk,” the authors say. “We believe this is a better way to meet long-term sustainability goals than just incorporating simple heuristic rules and focusing on only one metric.”
An upcoming whitepaper will discuss the benefits of optimization in more detail.
We invite you to download the whitepaper and explore all of its findings and charts.
1 ‘What’s in a name: The ESG edition,’ Stubbs, R., Brown, M., Qontigo, October 2022.
2 Rob Stubbs is Head of Incubation at Qontigo. Melissa Brown is Global Head of Applied Research.
