In an article1 last November, Melissa Brown of Qontigo’s Applied Research team showed that an investor willing to take on more active risk can gain higher exposure to the Sustainable Development Goals (SDGs), but the level of exposure varies by SDG. Additionally, one could achieve meaningful exposure even at a relatively low level of active risk.
Her follow-up white paper2 digs deeper into the sources of risk driving portfolios that have been optimized to ‘load’ on specific SDGs at a given point in time. Here, Melissa used end-2021 data from the Sustainable Development Investments Asset Owner Platform (SDI-AOP) to run simple optimizations that had the objective of maximizing exposure (defined by the percentage of revenue) to one, two or all SDGs. The STOXX® Global 1800 Index was the investment universe and benchmark. The only constraints employed were to be fully invested with a 3% target tracking error.
Melissa created four active portfolios, which respectively maximize exposure to all SDGs, SDG-3 (Good Health and Well Being), SDG-7 (Affordable and Clean Energy), and a combination of SDG-6 and SDG-13 (Clean Water and Sanitation + Climate Action).
In this article, we take the analysis further and put the same optimized SDG portfolios through the ROOF methodology. Qontigo’s ROOF (Risk-On/Risk-OFF) scores were created to quantify investors’ risk appetite, using investor behavior to determine whether they are risk-tolerant (bullish), neutral or risk-averse (bearish). The scores use a bottom-up methodology to gauge the implied sentiment of the average investor in the market, as well as the active sentiment of any portfolio against its benchmark.
Our aim is to compute the portfolios’ ROOF scores and determine the implied risk tolerance of an investor holding them as opposed to the STOXX Global 1800 parent. Note that the following analysis was done at a single point in time — December 31, 2021— but that the ROOF methodology is adaptive to changes in the portfolio’s active exposures to both style and sectors.
Active ROOF scores
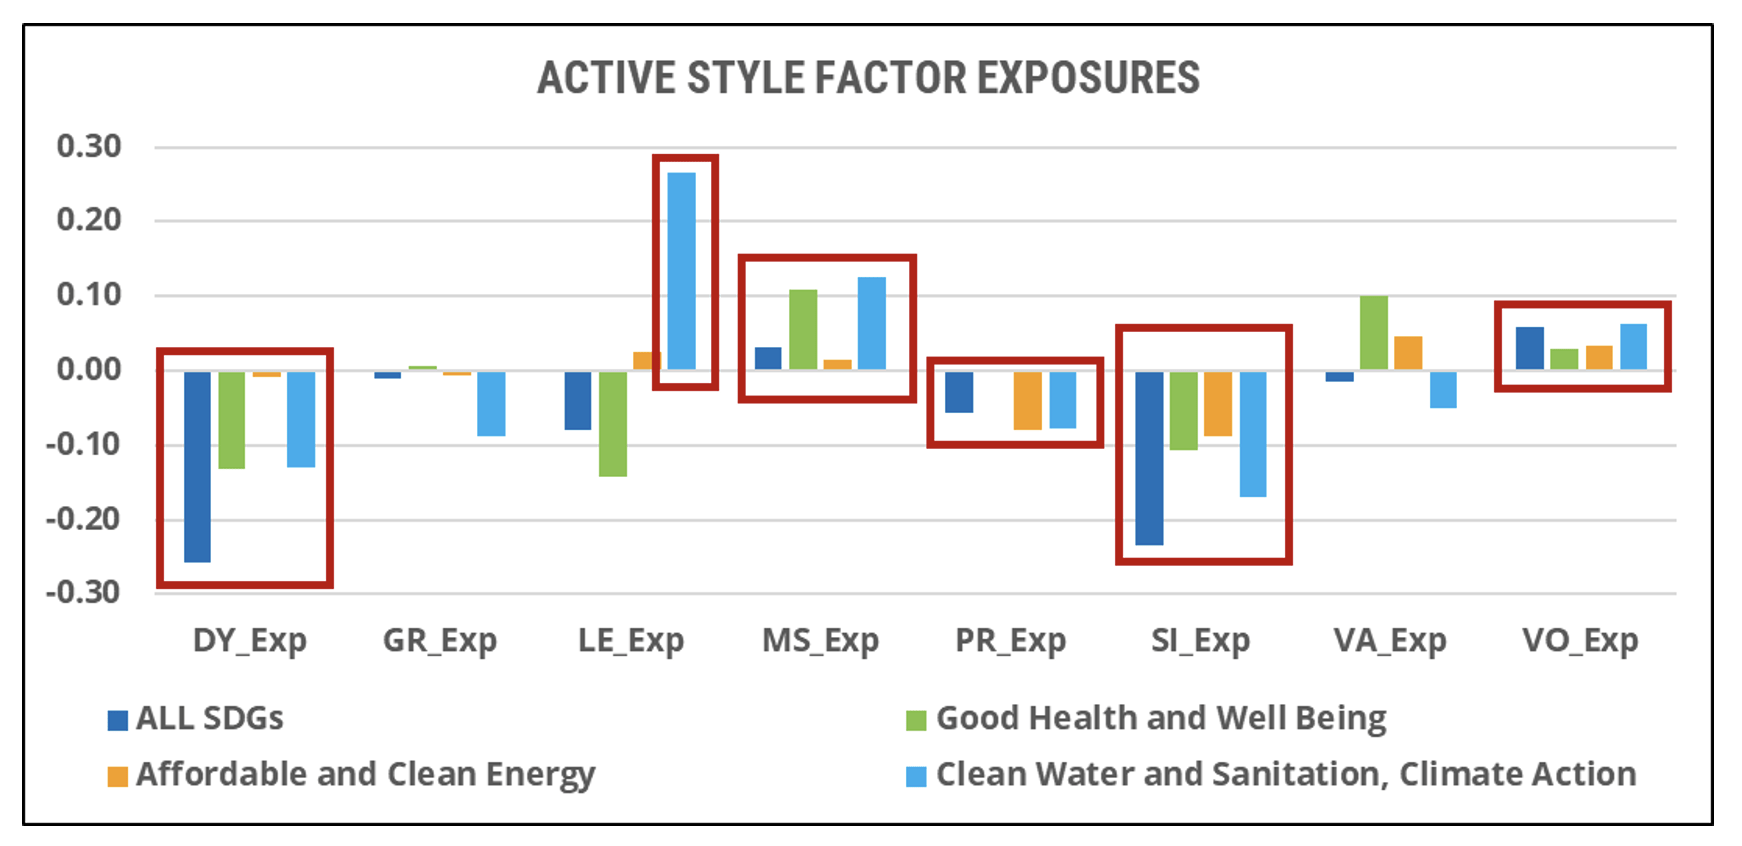
Figure 1 replicates the style factor exposures of the four optimized portfolios from Melissa’s second paper. All portfolios show a positive exposure to the Market Sensitivity and Volatility factors — both risk-tolerant characteristics according to the Style ROOF classification, since they attempt to take on more market risk than the average stock. They also have negative exposures to the risk-averse Dividend Yield, Profitability and Size factors. Low Dividend Yield and low Profitability are risk-tolerant characteristics, as is negative Size (small-cap tilt) since smaller companies tend to be more economically sensitive than their larger peers. We also note that the portfolio targeting a combination of SDG-6 plus SDG-13 (Clean Water and Sanitation + Climate Action), has a very large positive exposure to Leverage — another risk-tolerant characteristic since investing in companies with a lot of debt is much riskier than investing in debt-free companies.
Figure 1: Active style factor exposures

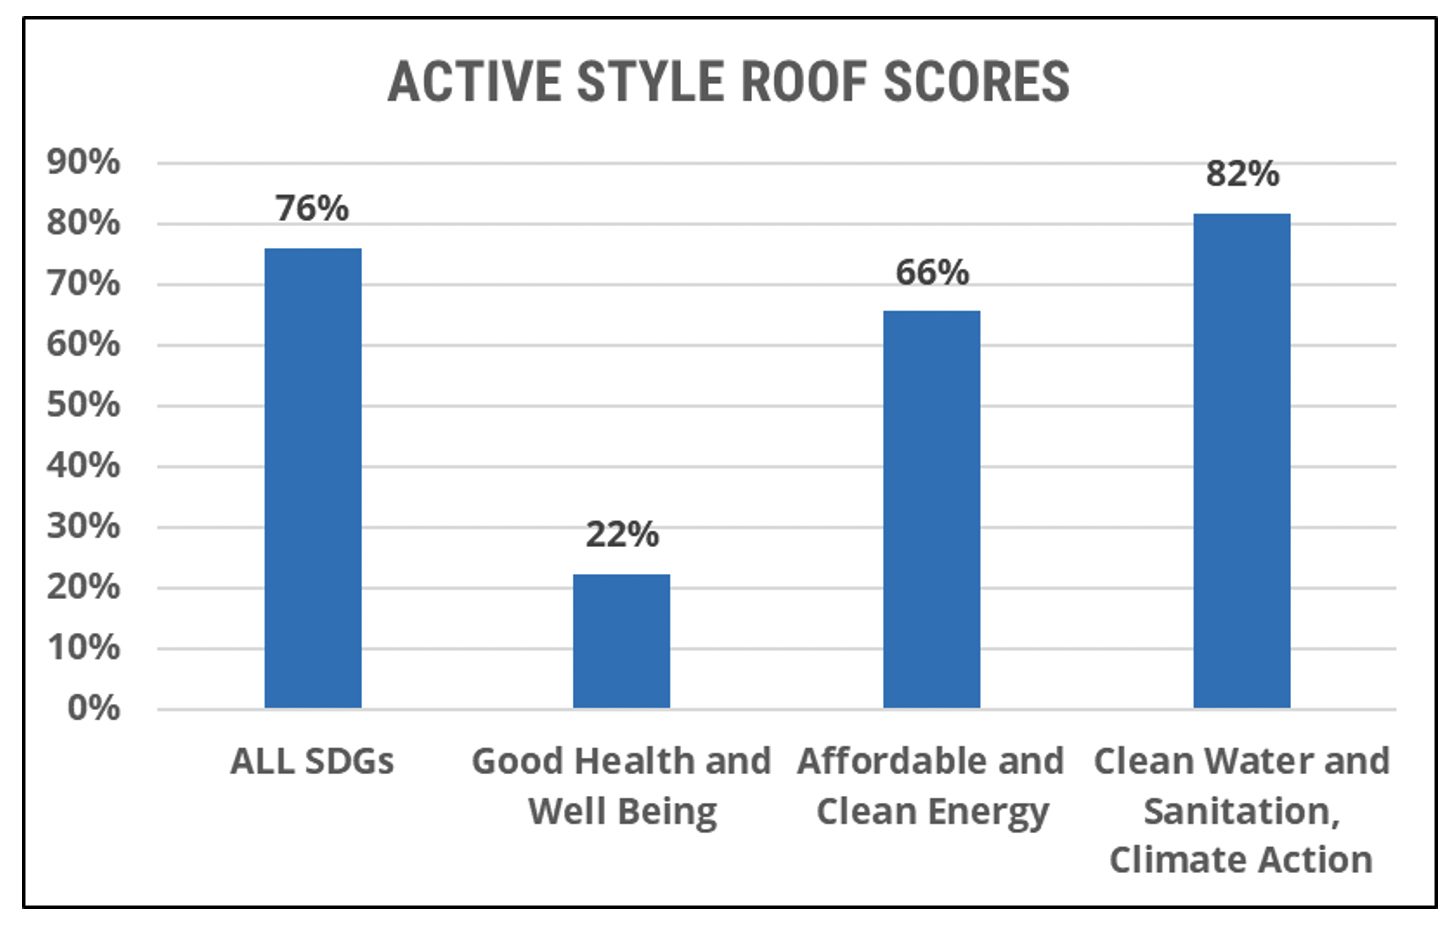
Not surprisingly, the above active style factor exposures translate into mostly (very) risk-tolerant ROOF Scores for our optimized SDG portfolios. Figure 2 shows the implied amount of active risk tolerance an investor would need to justify owning these portfolios versus the risk tolerance for holding the benchmark. Except for SDG-3 (Good Health and Well Being), which is almost neutral (+22%) in terms of risk appetite versus the benchmark3, holding all other portfolios implies a much higher risk appetite. In other words, the style factor exposures (i.e., high beta, volatile, unprofitable, small caps) of these portfolios are more reliant on a bullish outlook on the economy for them to outperform the benchmark.
Figure 2: Active style ROOF scores

Most of the difference in implied risk tolerance levels between SDG-3 (Good Health and Well Being) and SDG-6 + SDG-13 (Clean Water and Sanitation + Climate Action) can be explained by looking at their respective active exposures to the Leverage (a risk-tolerant style) and Value (a risk-averse style) factors. While the SDG-3 portfolio invests in companies that are undervalued and have less leveraged balance sheets, the SDG-6 + SDG-13 portfolio invests in businesses that are higher priced relative to book value, have lots of debt to repay and are also currently unprofitable. This helps explain the much higher implied risk tolerance of an investor holding the latter portfolio.
Conclusion
As Melissa mentioned in the title of her report, there is no free (risk) lunch in achieving SDG exposure, and the ROOF Scores of SDG-optimized portfolios confirm this. But this is also intuitive. Our current development trajectory isn’t sustainable, and reverting that will require the introduction of new and innovative technologies. Some of these technologies will be disruptive in many ways to existing business models, and it is not surprising to see most of them are being developed by new, small, yet-unprofitable companies, which at the same time may have had to borrow a lot of capital to finance their R&D efforts. This is confirmed by the style factor exposure of portfolios optimized for each SDG. These styles traditionally command a certain risk premium, which is precisely what the ROOF methodology is designed to quantify. It is, therefore, not surprising to see that betting on disruptive technology to solve some of our biggest sustainability issues requires a somewhat contrarian investment mind, and a higher risk appetite. So, if you are hungry for sustainability, you may need to sprinkle a little more risk tolerance on your portfolio.
* Olivier d’Assier is Head of Applied Research for Asia/Pacific at Qontigo.
1 “When it comes to sustainability, you can accentuate the positive, not just eliminate the negative,” Qontigo, November 2021.
2 ‘Want to incorporate SDG exposures into your portfolios? There’s no such thing as a (risk) free lunch, but here’s a way to do it…’, Qontigo, May 2022.
3 A ROOF Score between +/- 20% from the benchmark is considered neutral.
