The goal of many investors is to improve the sustainability profile of their portfolios without straying too much from a market-cap weighted benchmark. In other words, they want to maximize their ‘green’ exposure while limiting active risk.
A common first step for investors in this journey is to remove investee companies deemed undesirable from an ethical or sustainability standpoint.
In the first of a series of whitepapers1 that explore the construction of sustainability portfolios, Qontigo analysts Melissa Brown and Rob Stubbs look into the risk implications of a basic negative screening strategy. Importantly, they show that the use of an optimizer and a risk model in the process can help reduce active risk, freeing up more of the risk budget to increase the allocation to sustainable holdings or to those expected to generate better returns.
Brown and Stubbs analyze the risk profile of a portfolio derived from the STOXX® Developed World with four exclusionary screens:
- involvement in tobacco
- involvement in controversial weapons
- companies with highly controversial assets
- companies in breach of the United Nations Global Compact.
They then create an exclusions-only portfolio that simply excludes stocks and reweighs the remaining constituents, and an optimized portfolio that removes the same stocks and, through the Axioma optimizer and an Axioma worldwide risk model, allocates weights differently to minimize tracking error to the parent index.
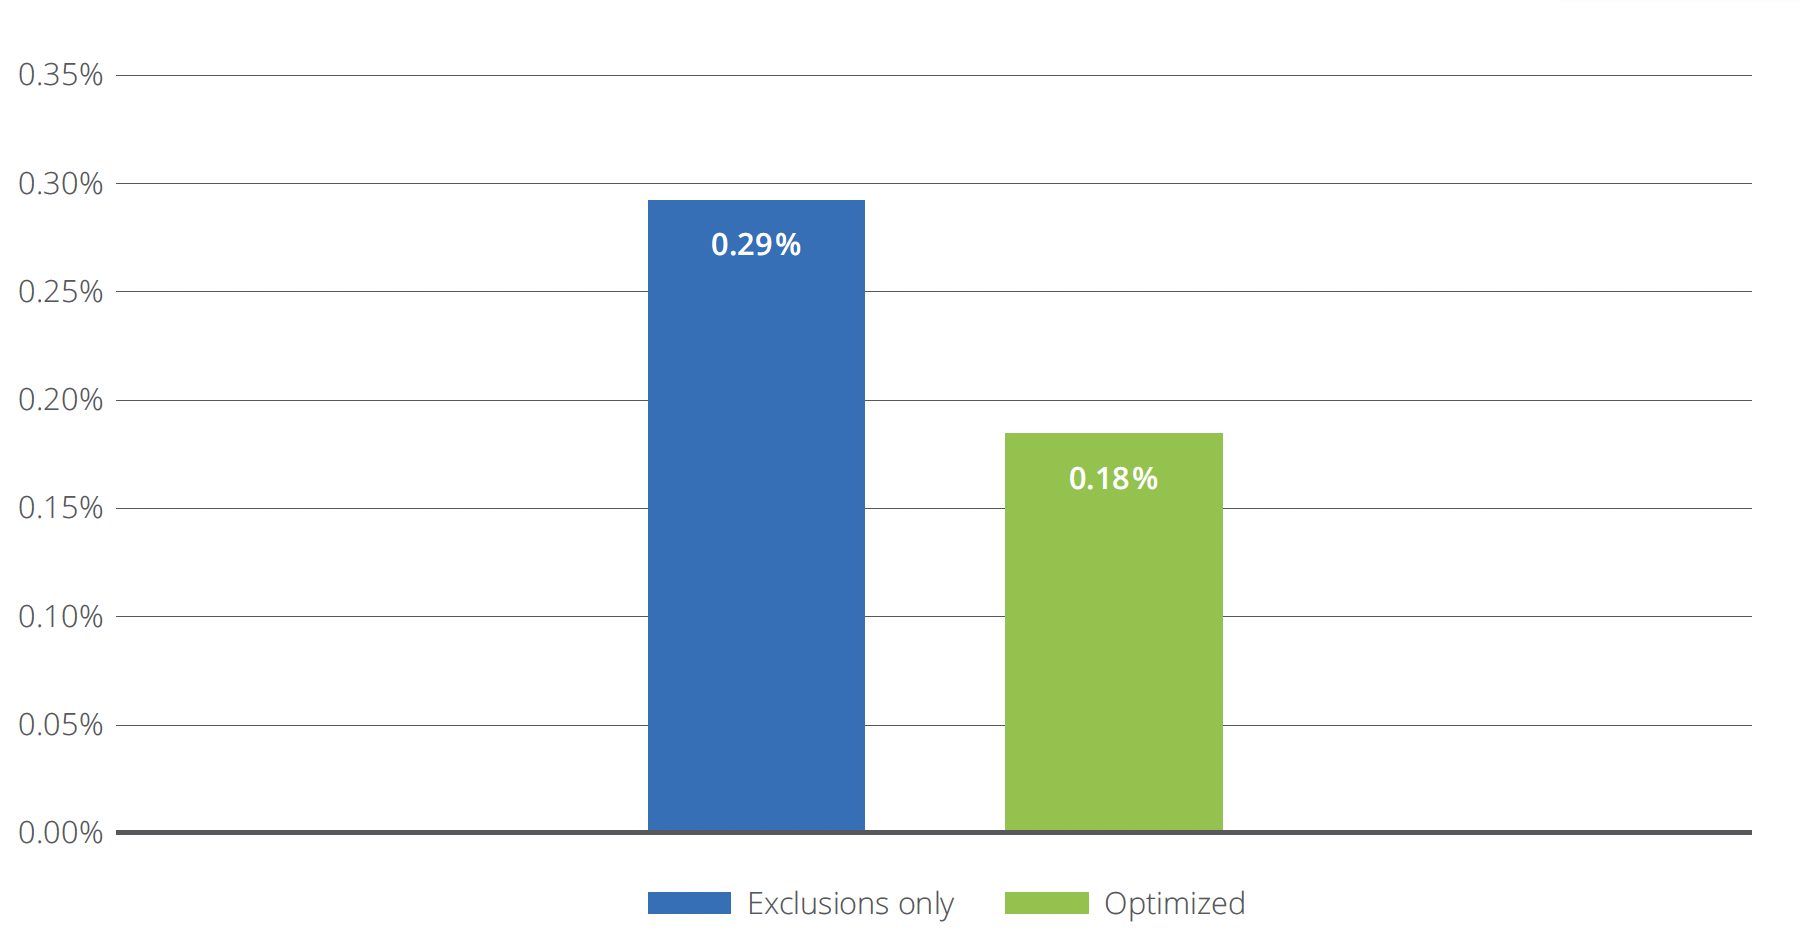
In the test, the optimized portfolio had just 18 basis points of predicted active risk, compared with 29 basis points for the exclusions-only version (Exhibit 1).
Exhibit 1: Tracking error of exclusions portfolios

The study’s backtesting analysis also shows that realized tracking error is consistently lower for the optimized portfolio over time. Furthermore, the analysts also found a more consistent stream of active returns in the optimized portfolio relative to the standard one.
How does the optimizer work?
The authors then explore how the optimizer is able to achieve a lower tracking error and what the resulting portfolio looks like. The study shows that the optimized portfolio ends up with fewer constituents and a slightly lower representation of the parent index’s weights than does the standard exclusions-only portfolio. These differences, however, were small considering the improvement in active risk.
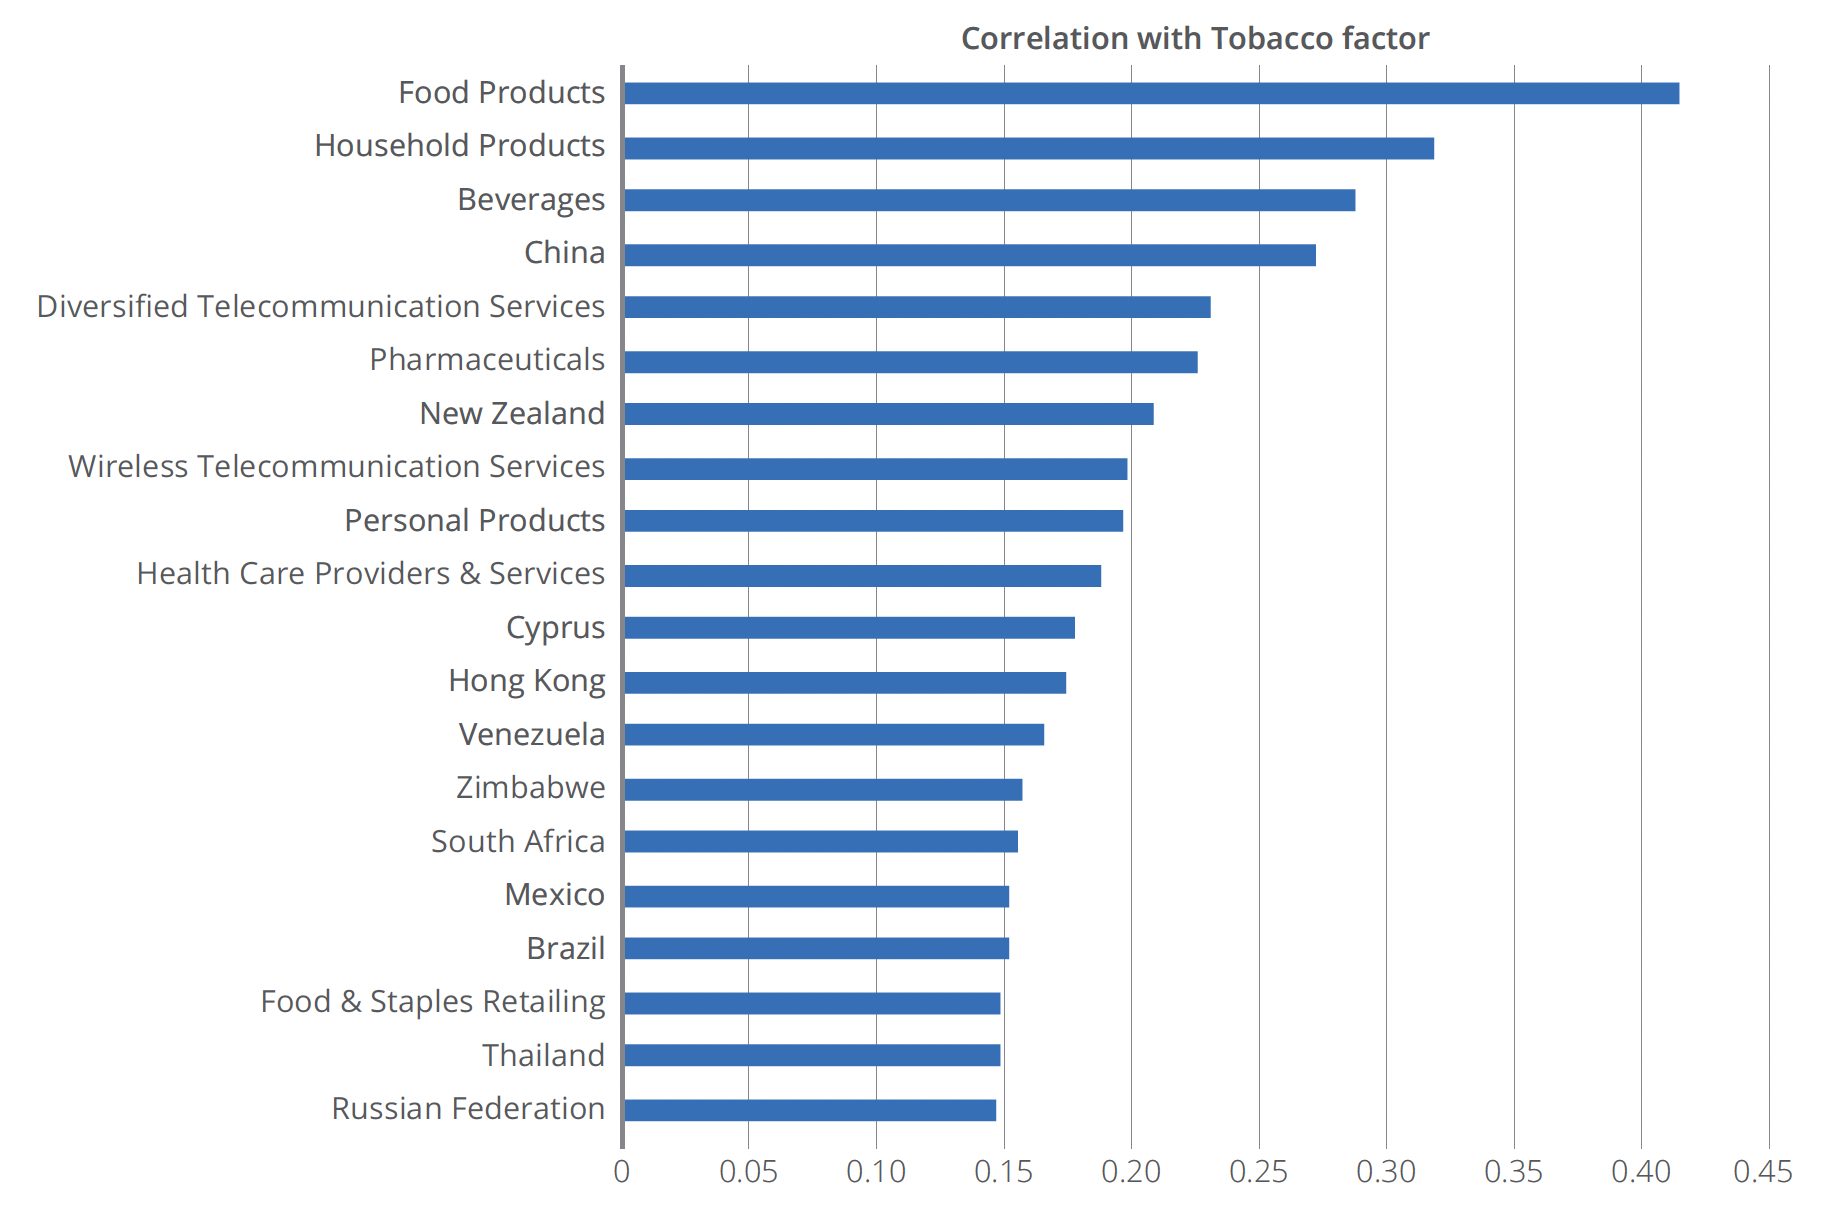
As they explain, the optimizer exploits correlations between different risk model components (such as specific industries) and excluded stocks. These correlations create “risk substitutes” for the disallowed companies. For example, a number of risk model factors (mainly industries, but also some countries, currencies and style factors) were found to be highly correlated with tobacco stocks (Figure 2). The optimized portfolio is thus able to offset the risk of not owning tobacco companies with, in this case, an overweight in the Food Products sector.
Exhibit 2: The 20 factors with the highest correlation to Tobacco

“Use of the optimizer, in conjunction with a risk model, recognizes that individual risk factors such as industries or style factors are correlated with other such factors, and that diversification can therefore be improved by taking advantage of these correlations,” the authors write. “Typical exclusions often introduce tracking error through tilts towards or away from risk factors. Replacing excluded stocks, either with highly correlated securities with the same factor characteristics or with securities in correlated factors, mitigates this.”
Crucial consideration
Active risk is an important consideration for sustainable strategies, and, as the authors note, it only becomes more relevant as the list of excluded activities grows and as investors and asset owners raise their ESG goals beyond initial exclusions. With both client objectives and regulation of sustainability-labeled indices and funds increasing, the optimal allocation of a portfolio’s risk budget will become only more crucial with time.
To download the whitepaper and find out more about the active risk, active variance analysis and comparative returns of an optimized exclusions portfolio, click here.
1 ‘Green efficient frontiers. Part 1: Minimizing the risk impact of exclusions,’ Qontigo, March 2023.
