
After two terrific years, the FAANGs — the acronym given to the stock group made up of Facebook (now Meta), Amazon, Apple, Netflix and Google (i.e., Alphabet) — have taken a beating in 2022, underperforming the US market by more than 10 percentage points year-to-date. Even after their recent plunge, the five stocks have not wiped out their pandemic gains and have still maintained a strong grip on the US market.
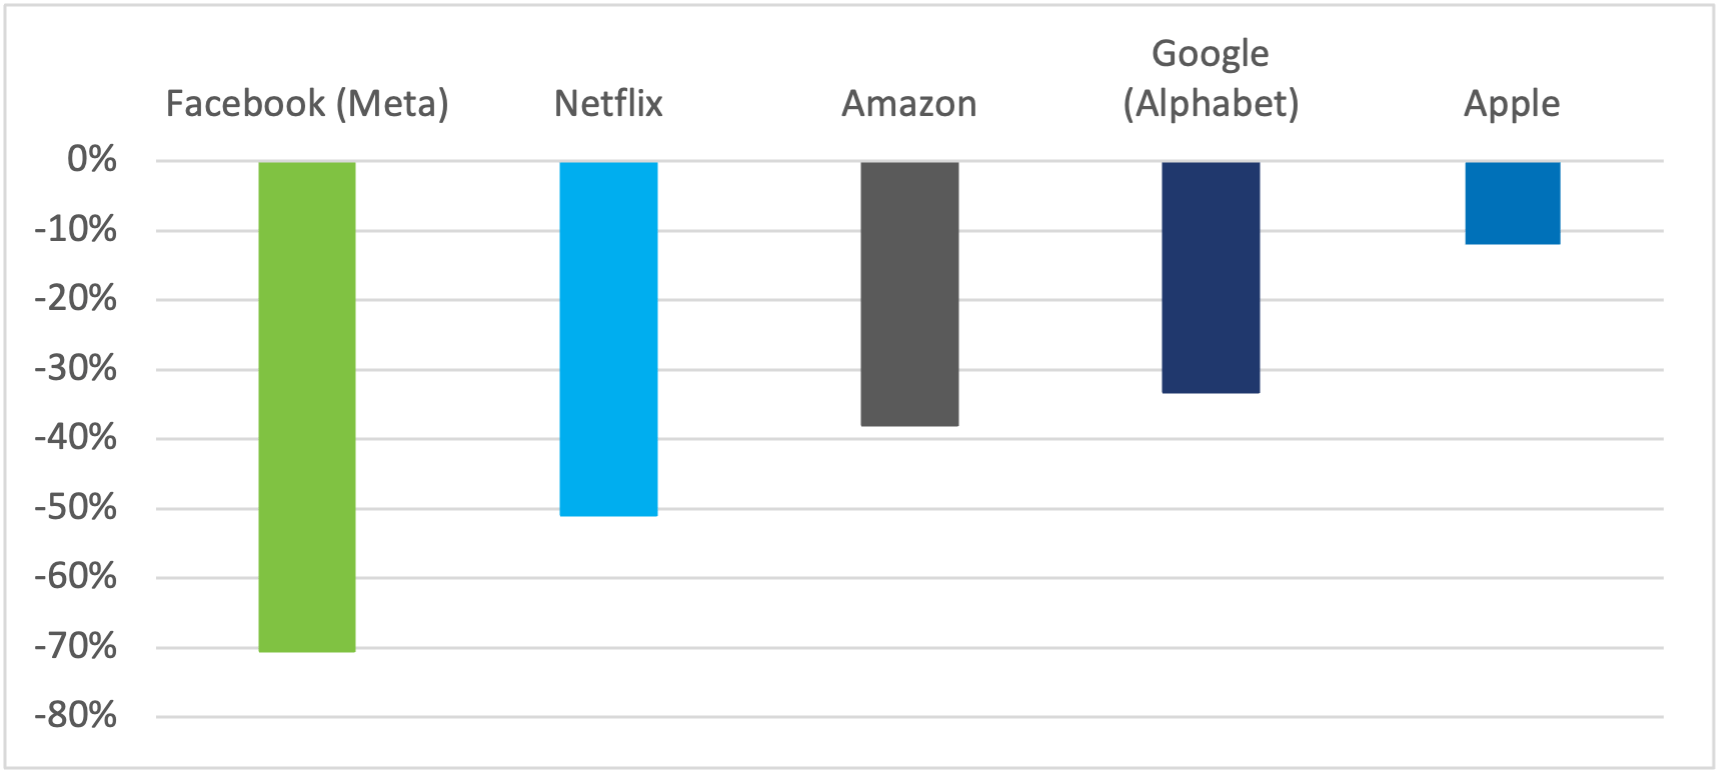
Out-of-control inflation, soaring interest rates, prospects for a global recession and mounting geopolitical risks have all put pressure on equity markets — and technology shares in particular. Last week’s disappointing earnings reports added to the pain, extending the FAANGs’ 2022 drop to between 12% (Apple) and 71% (Meta) as of October 28, 2022 (Figure 1). Only 17 out of all companies in the STOXX® USA 900 Index have had a worse year than Meta.
Figure 1 – 2022 YTD total return
We constructed a five-stock portfolio of FAANGs, with each company keeping the same proportional weight relative to the group as it does in the STOXX USA 900 index1. The last time we did a similar analysis we found that the FAANGs had an enormous impact on the US market, propping it up substantially during the pandemic year of 2020.
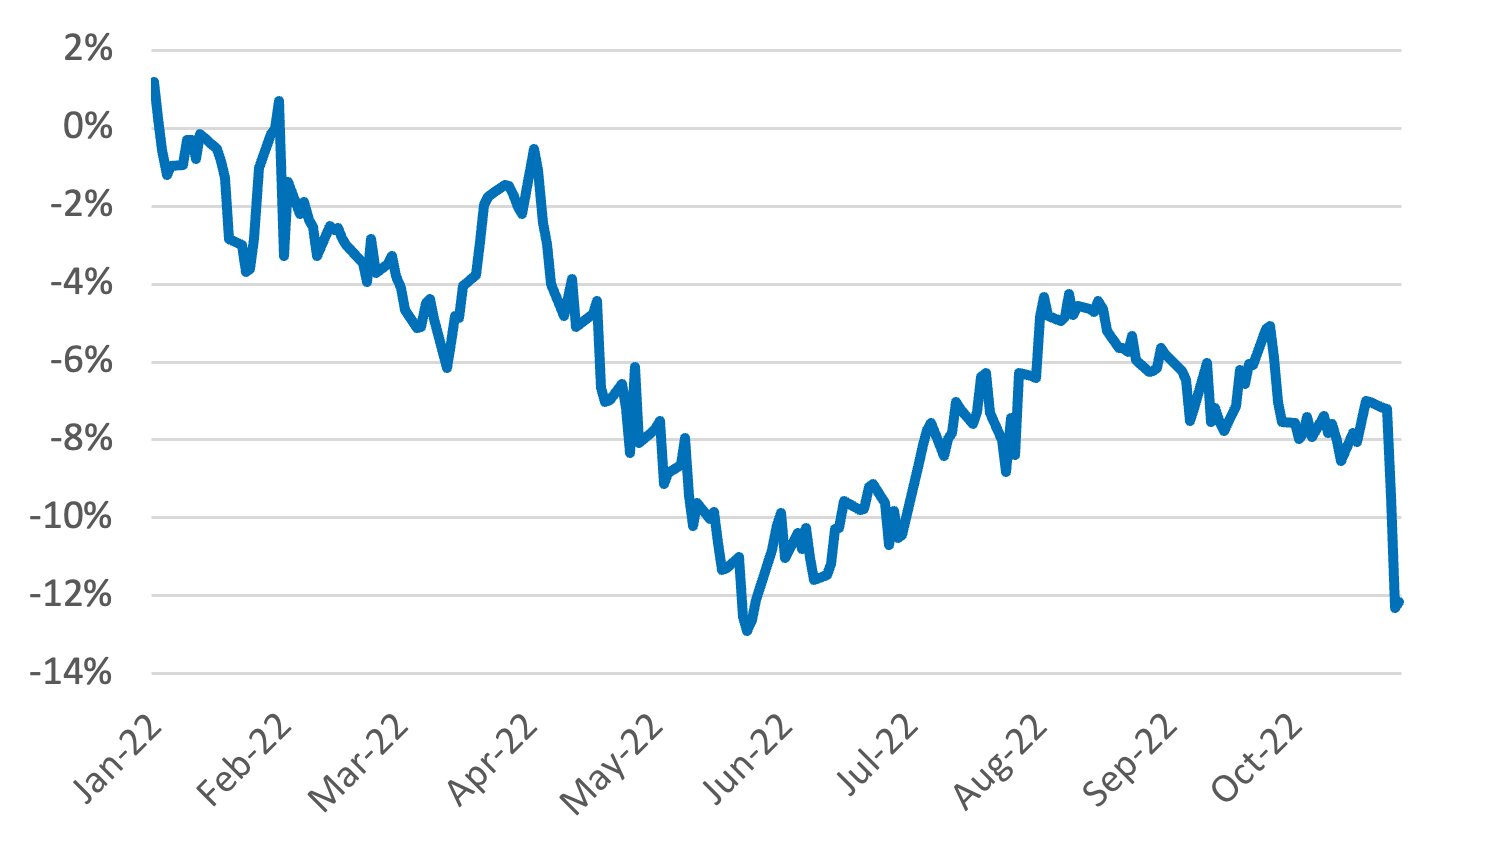
This time, we see the strong effect of last week’s earnings reports in the divergence in performance between the FAANGs portfolio versus the STOXX USA 900 index. While the FAANGs portfolio fell nearly 3% last week, the US market climbed 4% and FAANGs’ year-to-date cumulative excess loss widened abruptly to -12 percentage points (Figure 2). As FAANGs make up so much of the US market, the implication is that other stocks in the US index must have done much better than the FAANGs last week.
Figure 2 – Cumulative excess return FAANGs vs. STOXX USA 900 index
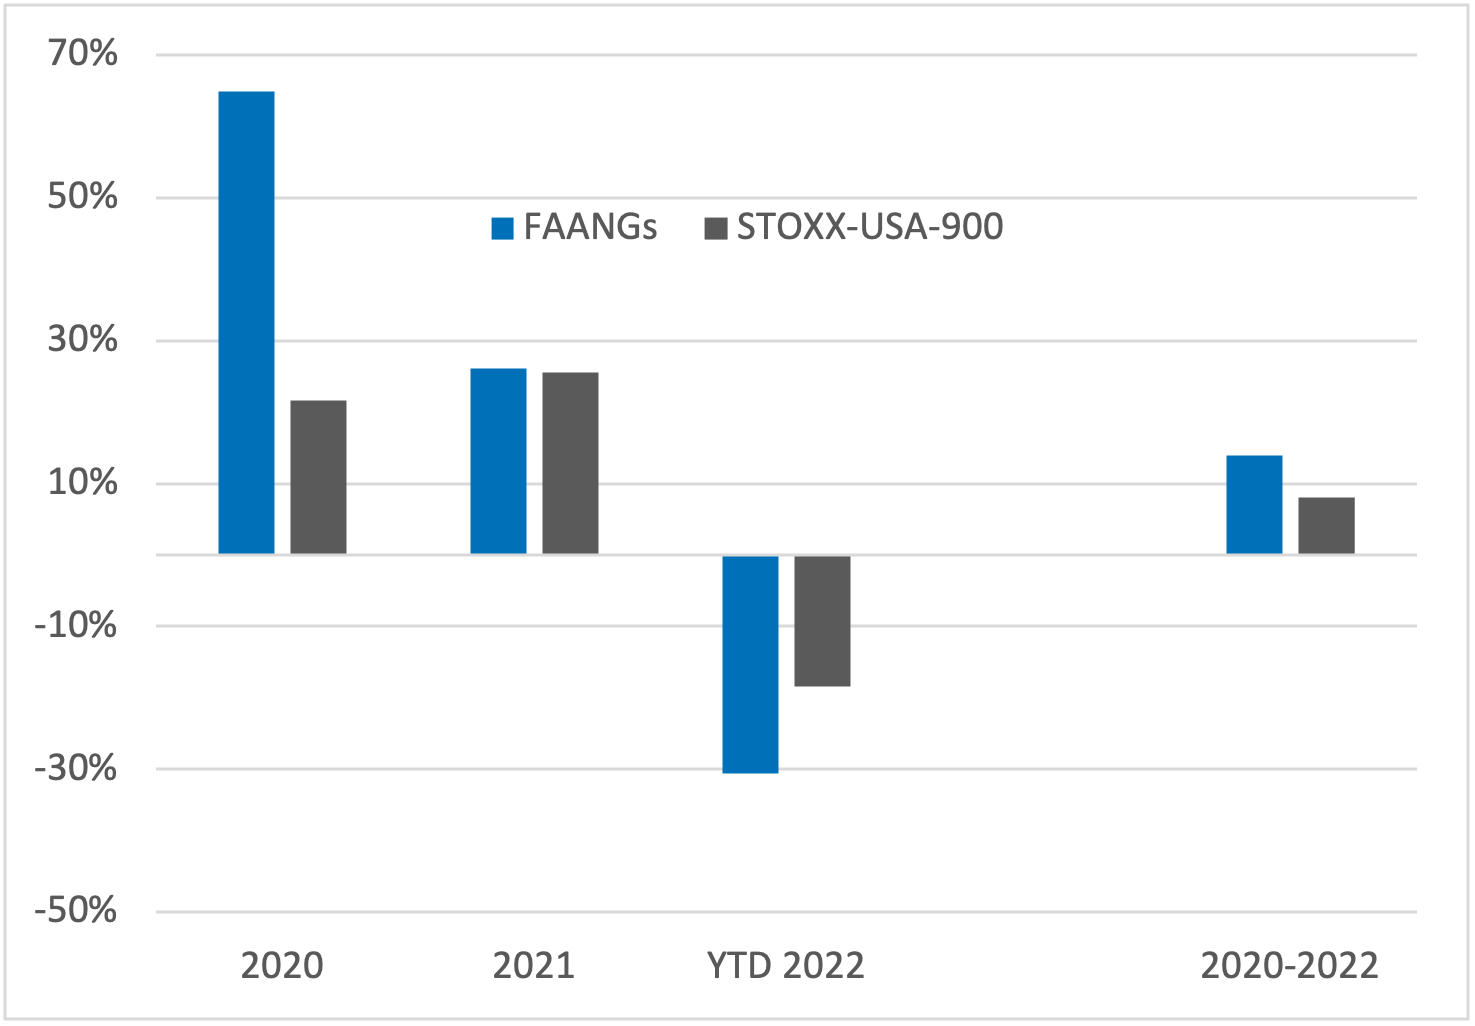
Still, the tremendous gains accumulated by the FAANGs during the pandemic years have not been fully wiped out yet (Figure 3). Propelled by their stellar performance in 2020, the FAANGs portfolio has posted an annualized return for the 2020-2022 period of 14%, outperforming the STOXX USA 900 index by 6 percentage points over this period.
Figure 3 – Annualized returns
The US market continues to see strong concentration in stocks, with the effective number of constituents2 in the STOXX USA 900 index remaining around pandemic levels (at 90). That is, a tenth of the stocks in the US index dominate the benchmark. To keep things in perspective: the effective number of stocks was 160 ten years ago, and 125 right before the pandemic (i.e., index concentration has worsened in the last three years).
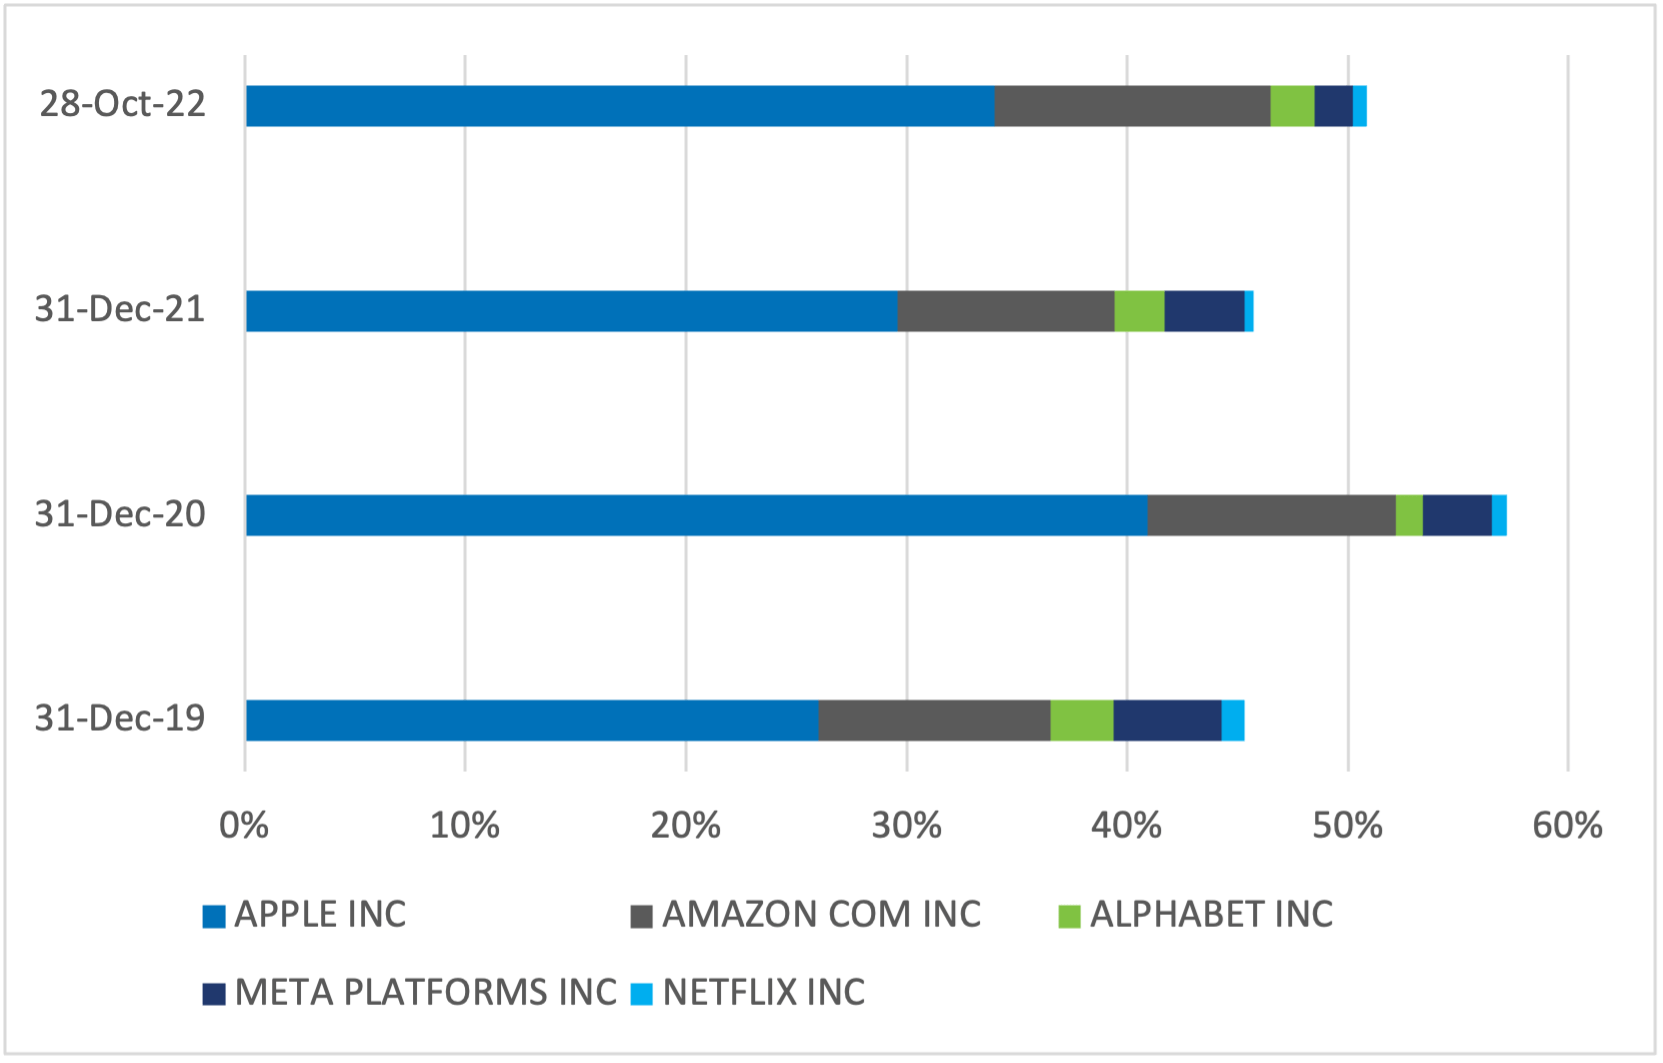
In addition, the FAANGs’ total weight in the index has doubled over the past decade, reaching a peak of 14% through 2020 and 2021 (Figure 4). With the FAANGs falling more than the overall US market this year, their individual weight in the US index has also shrunk (except for Apple), but not by much. They still accounted in aggregate for 12% of the weight in the STOXX USA 900 index on October 28.
Apple maintains the largest weight in the pack and is the only one to have seen a consistent increase in its weight in the US index over the past decade. Netflix, although having the smallest weight of all, has seen the largest weight increase over the same period. As of October 28, the FAANGs’ weights in the STOXX USA 900 index were as follows: Apple (6.6%), Amazon (2.6%), Google (1.7%), Facebook (0.6%) and Netflix (0.4%).
Figure 4 – STOXX USA 900 index’s effective number of stocks & FAANGs index weights

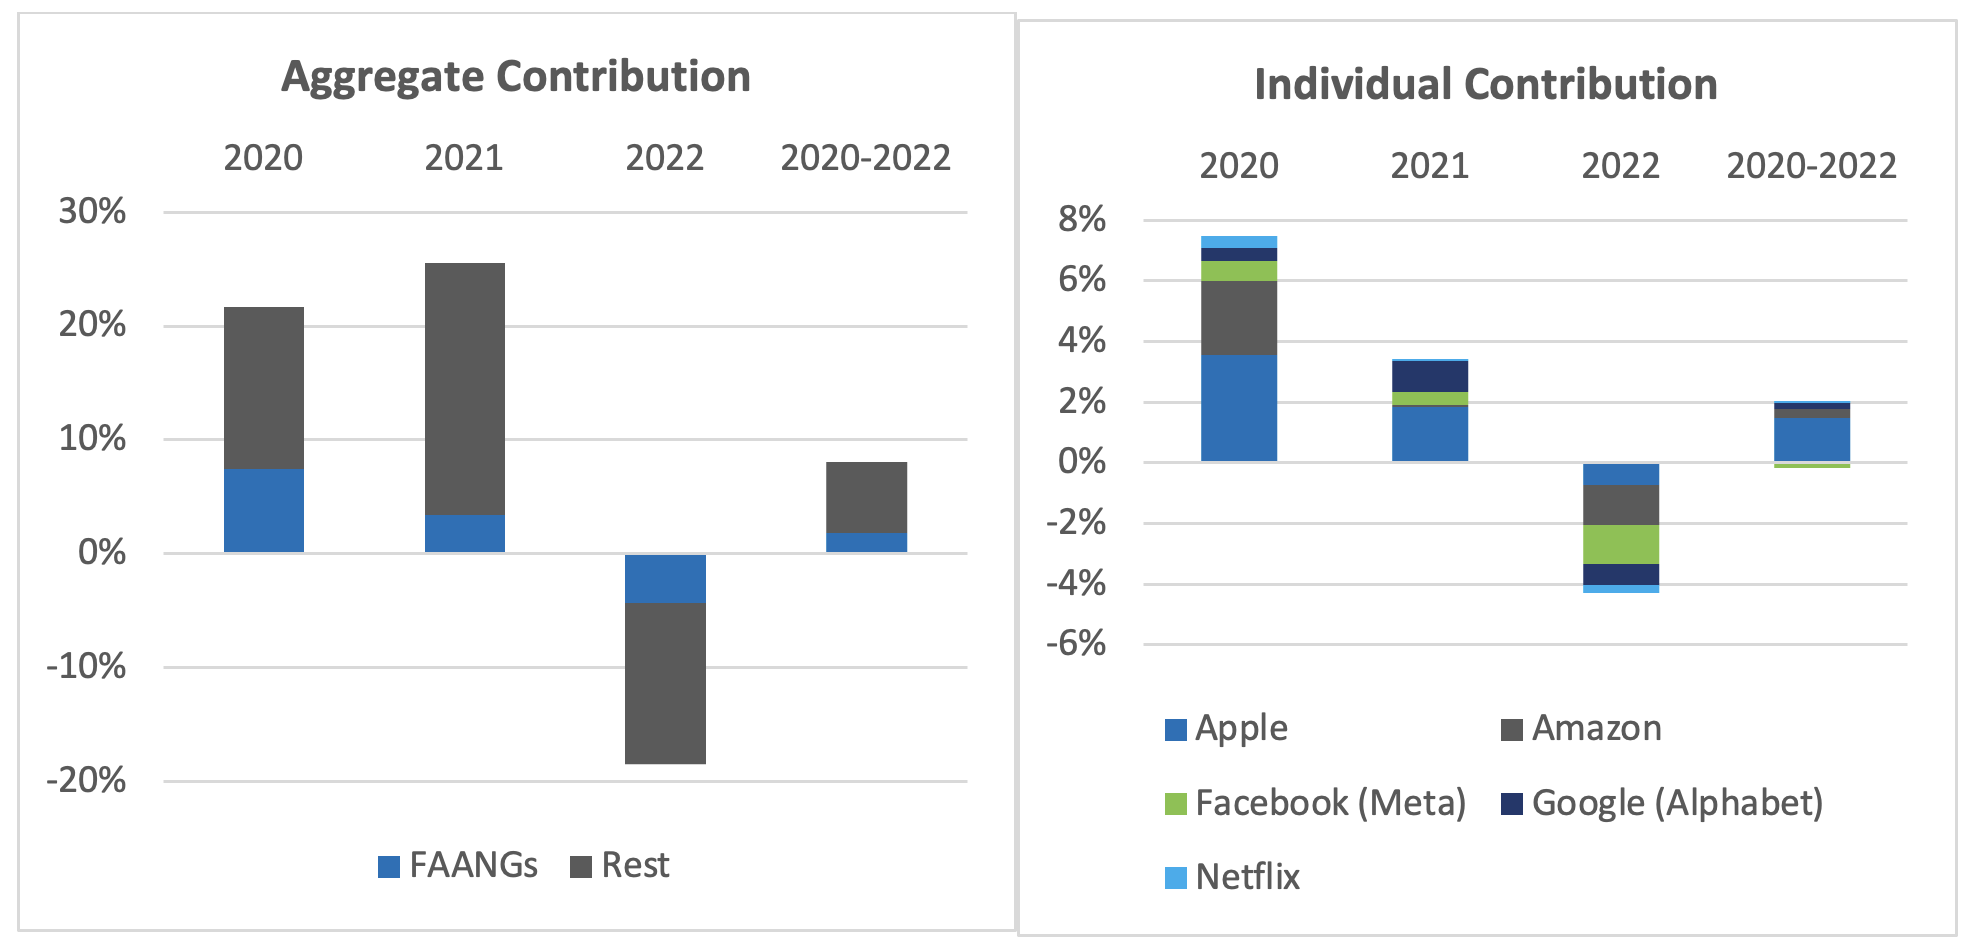
The sizable, combined weight of these five stocks in the US index, together with the stocks’ significant swings, was reflected in the FAANGs’ large contribution to index returns in recent years. In 2020, FAANGs’ returns contributed more than a third of the US index’s gain. In contrast, 23% of the US market decline this year is attributable to the FAANGs, with Facebook and Amazon being the largest detractors (Figures 5 & 6).
Figures 5 and 6 – FAANGs’ contribution to STOXX USA 900 Index returns
In the aftermath of the pandemic, we saw an extraordinary pattern where the risk of the FAANGs portfolio was remarkably similar to that of the 900-stock US index. However, this anomaly was short-lived and the risk gap between the FAANGs and the US market widened after the second half of 2020 (Figure 7). The FAANG’s risk reverted to the historical trend: mirroring that of the US market albeit at a higher level, as measured by Axioma’s US4 fundamental short-horizon model.
In addition, the FAANGs’ contribution to benchmark risk was above that of their aggregated weight in the STOXX USA 900 index on October 28, confirming that the FAANGs were somewhat riskier than the rest of the index.
Figure 7 – Total predicted risk, Axioma US Fundamental Short-Horizon Model
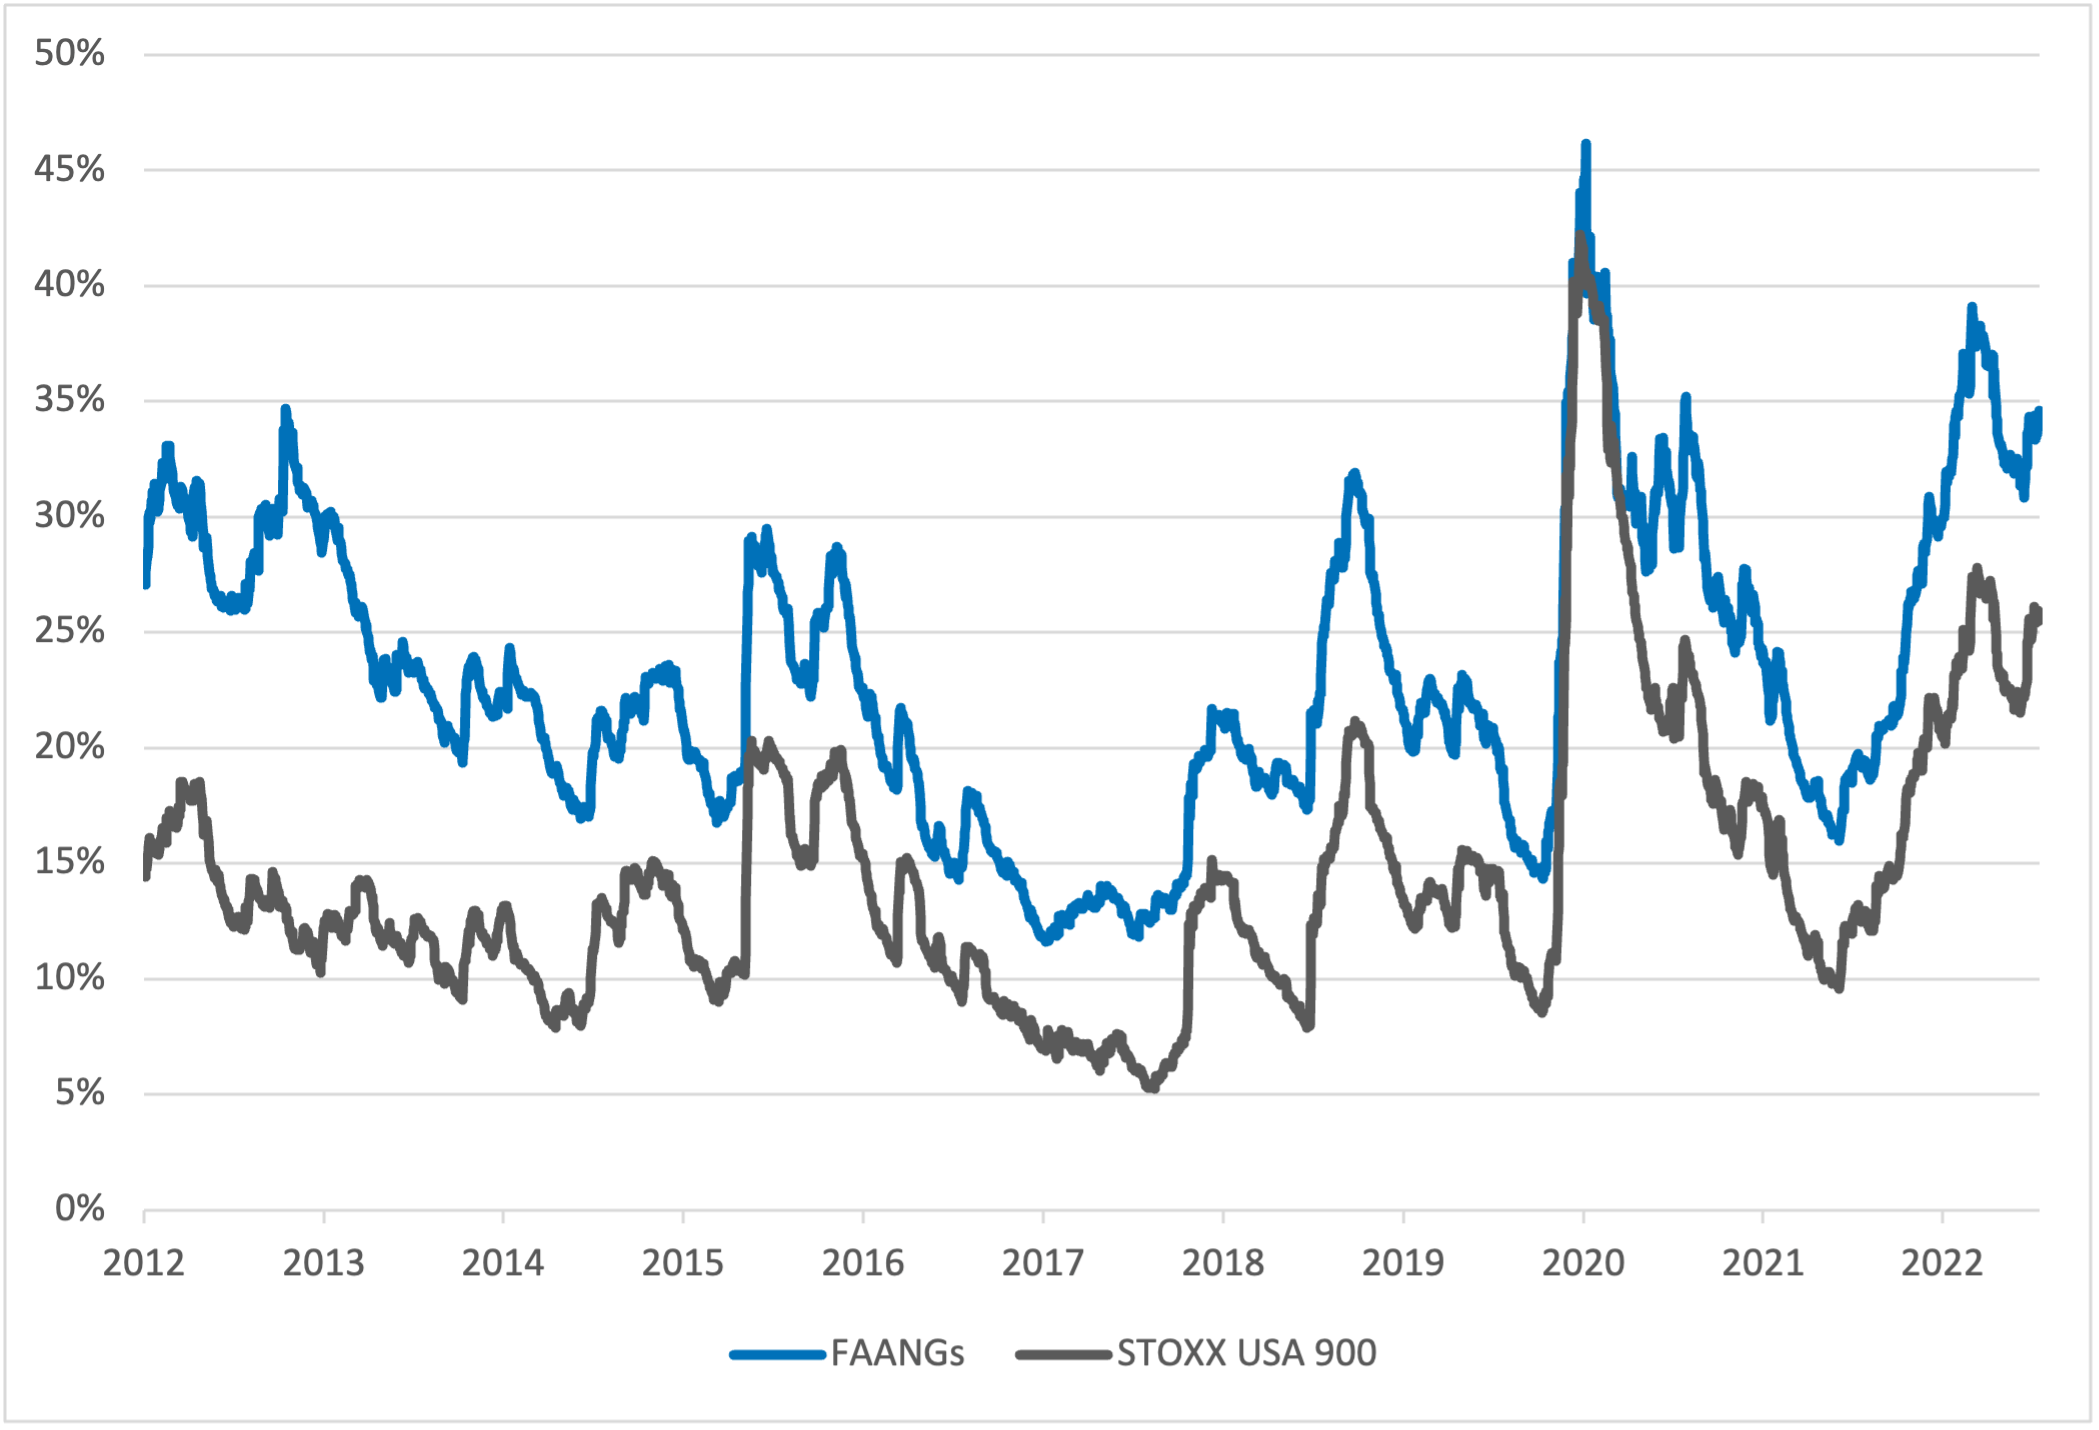
Specific risk accounts only for a small portion (about 10%) of the total risk of the STOXX USA 900 index, with factor risk explaining most of the volatility of the index. However, it is worth noting that FAANGs have contributed about half of the STOXX USA 900 index’s specific risk over the past three years, with Apple and Amazon adding the lion’s share (Figure 8).
Figure 8 – Percentage of specific risk
Of course, the FAANGs portfolio is expected to have a high tracking error to the market and this year has been no exception. For much of 2022, tracking error has been above the 10-year median of 14% (Figure 9). After reaching a year-to-date peak in May, tracking error declined until last week, when it skyrocketed following the beating of FAANGs stocks on earnings announcements. In five days, active risk jumped 150 basis points. Those tech-related bets have become a lot riskier this year.
Figure 9 – FAANGs vs. STOXX USA 900 index tracking error

In summary, the FAANGs fell abruptly this year, significantly underperforming the US market and having a large impact on the STOXX USA 900 index’s specific risk. Still, the stocks’ recent losses have not yet offset the gains accumulated during the pandemic years. The FAANGs’ tracking error versus the US market jumped in the wake of unfavorable earnings reports last week, with FAANGs becoming considerably riskier.
1 This is an update of the blog post The US market can thank its FAANGs even more now—just keep an eye on risk posted on October 13, 2020.
2 The effective number of stocks measures stock concentration in a portfolio and is calculated as the inverse of the Herfindahl-Hirschman Index.