
The recent collapse of Silicon Valley Bank and Signature Bank in the US and the forced takeover of Credit Suisse by rival UBS have sparked fears of contagion throughout the global financial system and, ultimately, the wider economy, rekindling memories of the so-called “doom loop” during the 2011 Eurozone debt crisis.
Christoph Schon
As Senior Principal for Applied Research, Christoph generates insights into market trends with a particular focus on multi-asset class analysis and thematic investing.
So far, the effect on other sectors has been fairly contained, but a further deterioration of bank credit quality could drag other industries into negative territory as well. Our stress tests indicate that bank shares could fall another 15% in the US and almost 20% in Europe, if credit spreads were to widen another 200 basis points from their already elevated levels. But traditional defensive sectors, such as utilities, consumer staples or healthcare, could provide some protection, with losses projected to remain in the low single digits.
For most of the past two decades, spreads on bank debt have vacillated largely in line with overall credit risk premia. The dark blue line in Figure 1 shows the 5-year yield pickup of USD-denominated, single-A-rated bank bonds over risk-free rates since 2007, while the green line represents the average spread of all corporate securities with the same currency and credit quality.
Figure 1 – Average 5-year spreads over USD risk-free rates for global corporates and banks
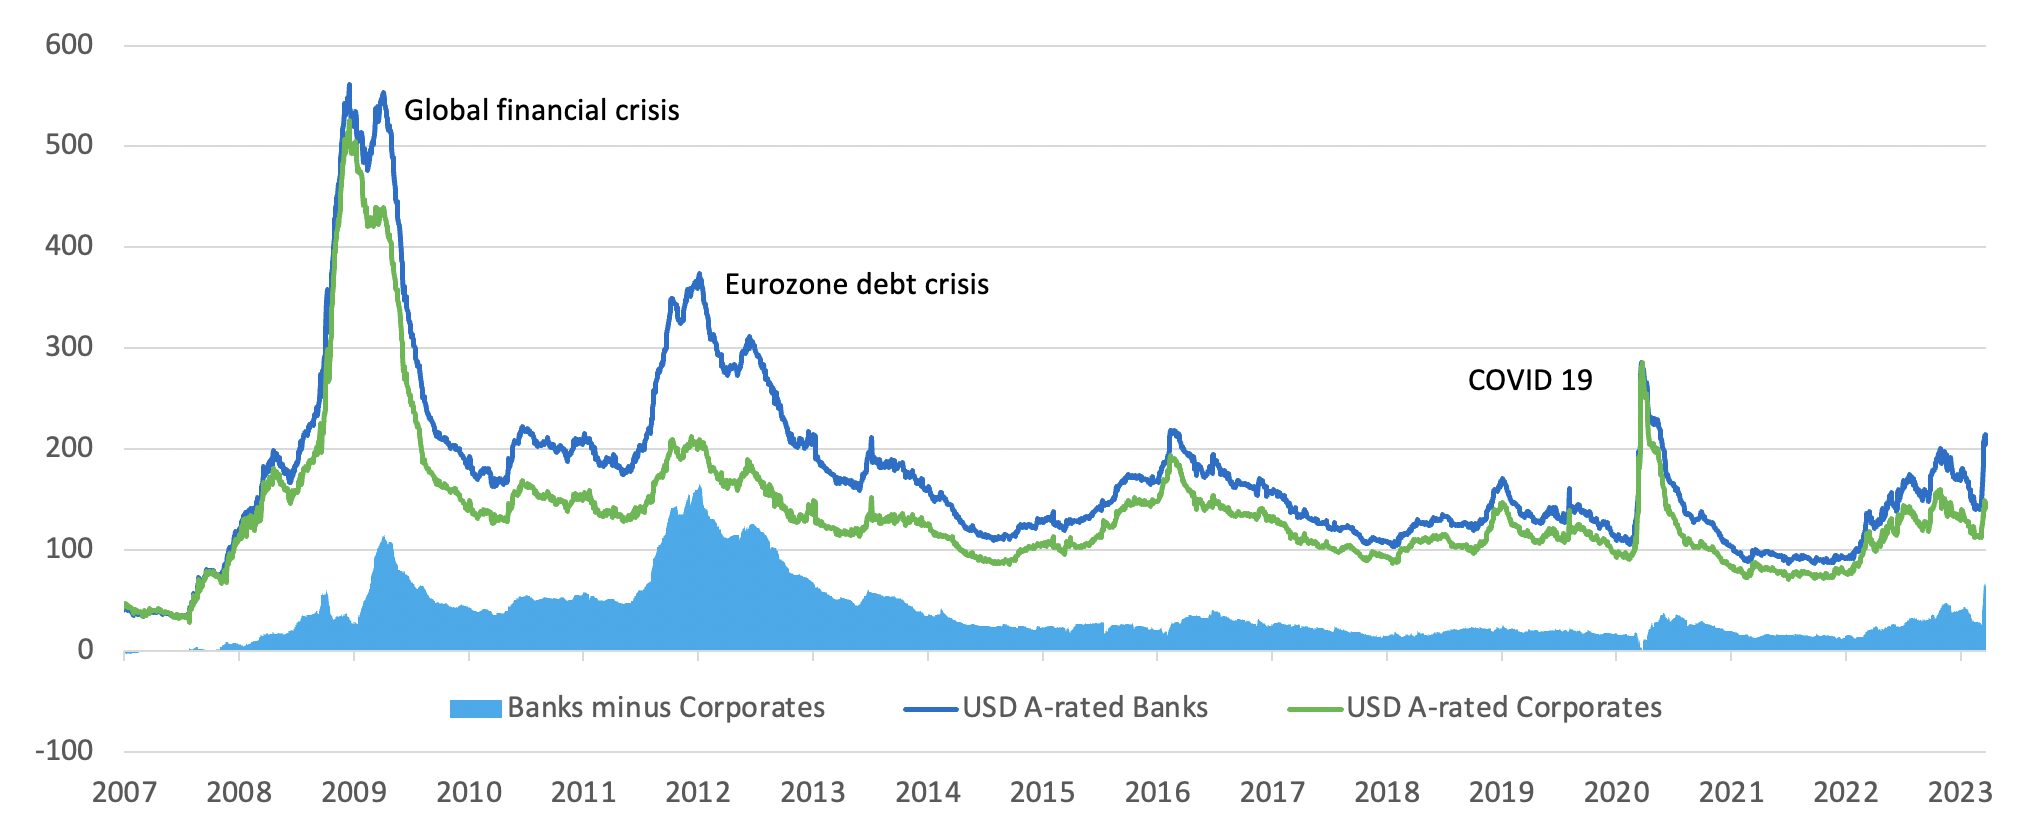
As seen from the light blue area, the two major exceptions when the two time series diverged were during the global financial crisis in early 2009 and the Eurozone debt crisis of 2011/12, when borrowing rates for financial institutions increased much more than for overall corporate debt. Especially in the second half of 2011, the yield differential expanded to 170 basis points, with the single-A bank spread peaking at almost 4%. At the moment, the latter has just spiked above 2%, with a pickup of more than 60 basis points over all corporates — its widest since the end of 2012.
The similarity between the recent problems of the troubled US banks (the issues with Credit Suisse appeared to be of a more deep-rooted, structural nature and have been going on for much longer) and the Eurozone debt crisis is that in both cases, the affected institutions had large holdings of long-dated government debt that were marked down significantly as interest rates soared.
Equity market impact
The charts in Figure 2 show simulated returns for representative US (left) and European (right) equity sector portfolios under a range of historical and transitive scenarios. The light blue bars indicate how today’s portfolios would have fared under market conditions prevalent in the second half of 2011, while the green bars represent their hypothetical returns based on market movements since March 8, 2023. The dark blue bars are projected future returns if credit spreads for USD-denominated, single-A-rated banks were to widen another 200 basis points. The betas and covariances for the latter stress test were calibrated using daily returns since March 8.
Figure 2 – Simulated returns for US (left) and European (right) equity sectors[1]
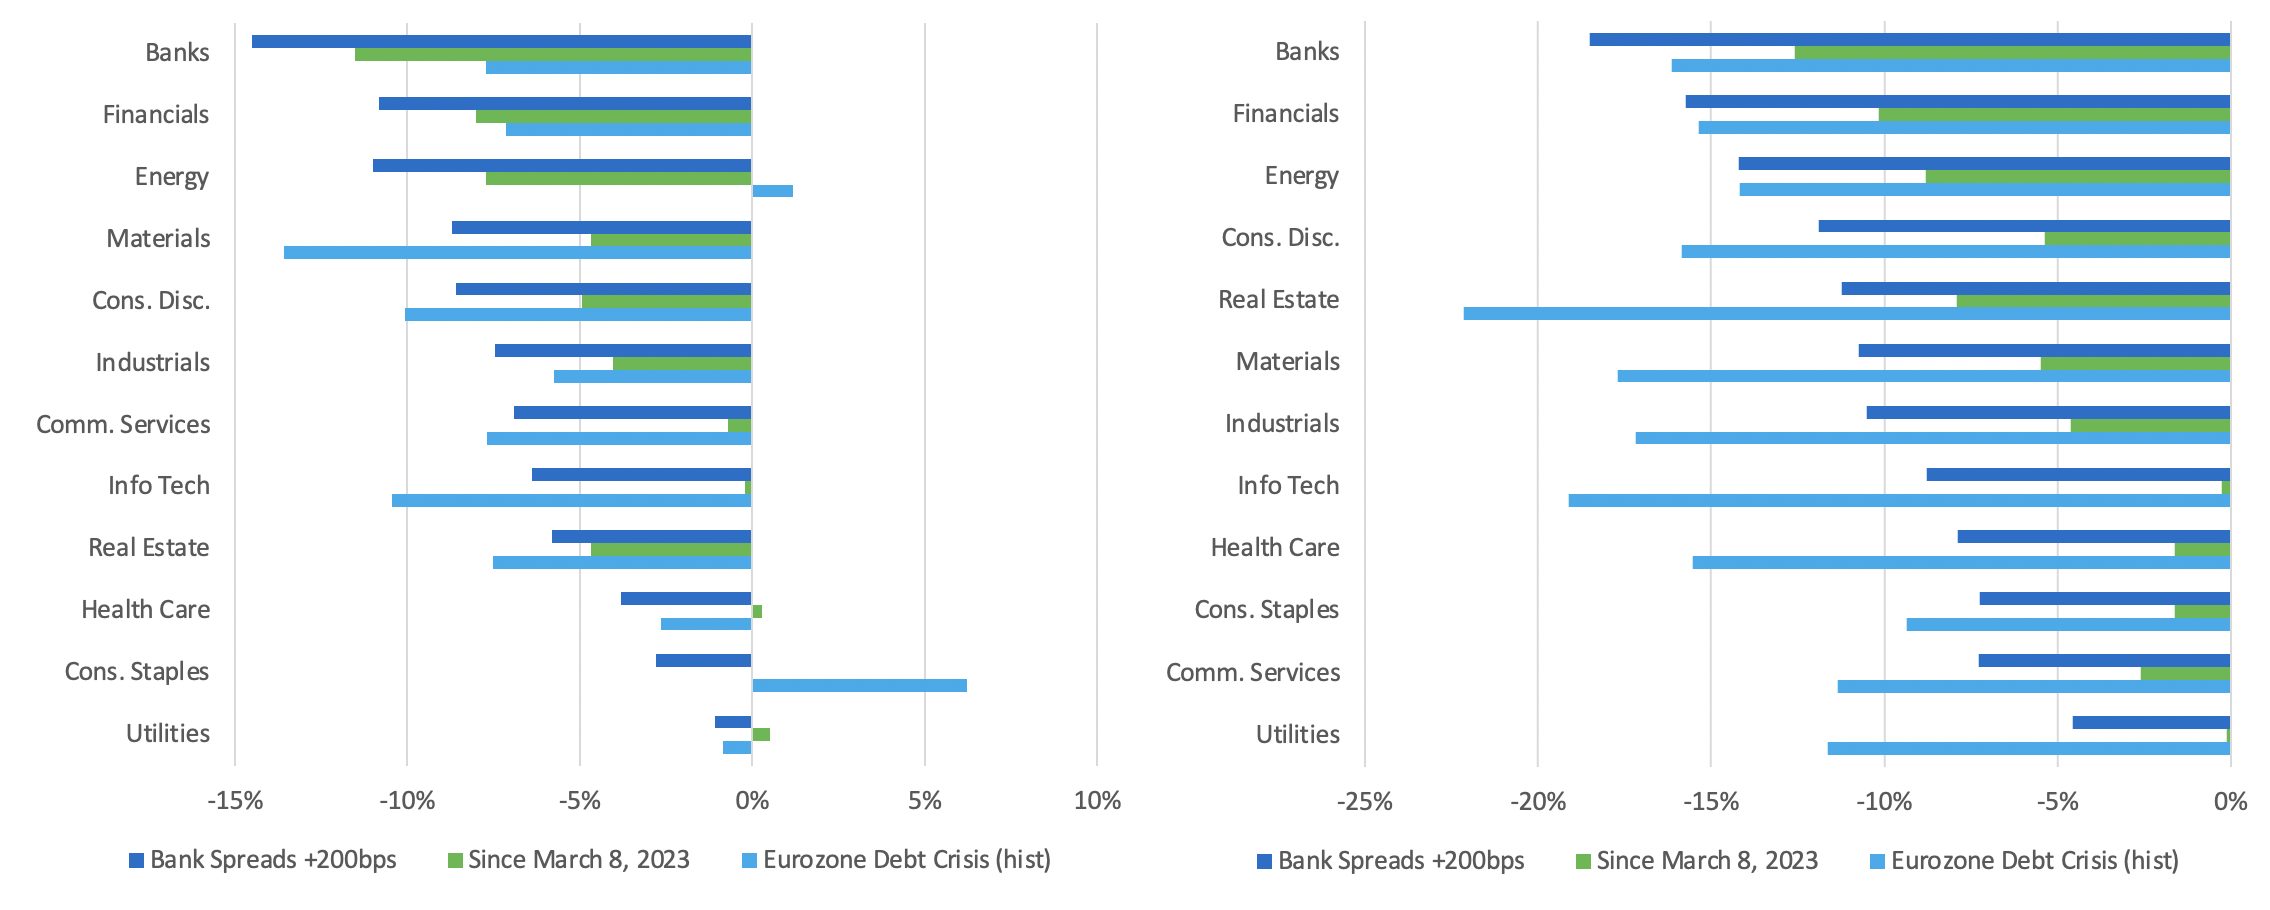
The green bars in both charts indicate that the most severe share-price losses have so far been concentrated in the financial and commodity sectors, while technology, healthcare and utility stocks have to date escaped largely unscathed. Between March 8 and 22, 2023, global bank shares lost 11% on average, compared with -1.4% for the STOXX® Global 1800. However, if spreads on bank debt were to widen another 200 basis points from their current levels, the dark blue bars predict losses across all sectors, with US bank stocks projected to shed another 15%. The pullback could be even larger for their European counterparts, which could lose as much as 19% of their market capitalization.
That being said, the downturn can be expected to be much more benign in traditionally defensive industries, with losses being confined to single digits for utility, consumer staples and healthcare companies. The historic returns from the Eurozone debt crisis, represented by the light blue bars, appear to confirm this notion.
Debt market impact
The picture looks slightly different in the debt market, where credit spreads widened across all sectors, though the underperformance was much more severe for financial securities. Figure 3 depicts excess returns of USD-denominated corporate bonds over US Treasury securities. In order to make returns comparable across sectors and time periods, the performance numbers were normalized to an average duration of six years.
Figure 3 – Simulated excess returns for USD-denominated corporate bonds
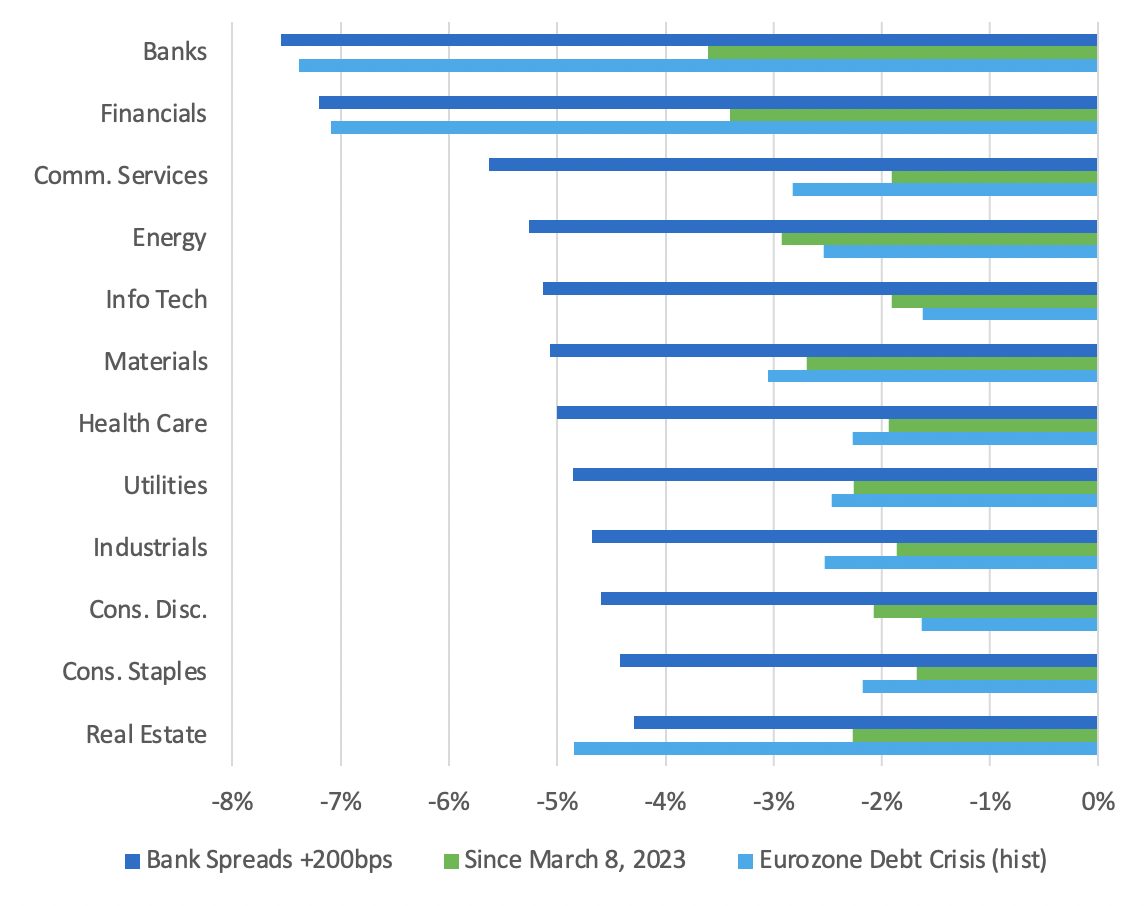
Even though the recent excess returns (represented by the green bars) were negative, the simultaneous flight to quality meant that the plummeting sovereign yields largely compensated for the wider credit spreads, resulting in flat or even slightly positive total returns for most non-financial securities. The inverse relationship is likely to persist if things take a further turn for the worse, thus cushioning at least some of the projected losses shown by the blue bars.
Should investors be worried?
The stress tests indicate a certain degree of contagion with all parts of the economy eventually experiencing losses, if credit conditions were to deteriorate to the levels observed during the Eurozone debt crisis. European bank shares especially could suffer additional losses of up to 20%. However, not all sectors will be hit equally hard, and more traditional defensive industries like utilities, consumer staples and healthcare might offer some refuge. Corporate bonds are also likely to get some relief from lower risk-free rates, which would dampen the blow of higher credit risk premia.
[1] The sectors displayed are GICS sectors (level 1), apart from Banks, which represent the industry group (level 2) within the broader Financials sector.