The global financial crisis significantly changed the industry composition of European equities, enhancing sector diversification relative to the market’s own history and to other major regions.
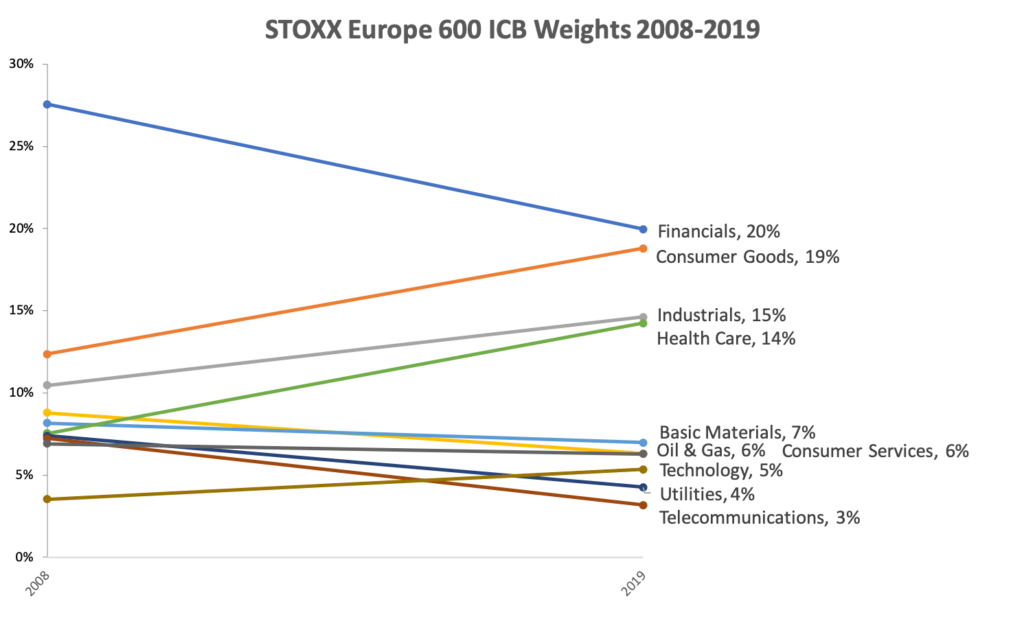
At the core of this change is the banking sector, whose members have underperformed in the face of tepid economic growth, low interest rates and tighter capital rules. In March 2008, financials represented 27.6% of the STOXX® Europe 600 Index,1 a weight that made them dominant in the fortunes of the benchmark. Fast forward just over ten years, and the industry’s weight has fallen to 20%, ceding space to consumer goods, industrials and health care in the ranking of relevance (Chart 1).
Chart 1

As a result, the standard deviation of the ten industries’ weight has decreased over the period, signaling that they, as a group, are now closer to a mean than before.
The drop in banks’ allocation is likely to be a welcome development for investors as it has eased industry concentration, which increases the risk of large index moves. Active investors have the freedom to diverge from the benchmark, but they can be constrained by tracking error.
While energy and basic-resources stocks also lost relative weight in the past decade, it was the income sectors of utilities and telecommunications that shed the most presence in relative terms. In both cases, they lost around half of their weight during the period, due to factors affecting the two industries.
US and Asian cases
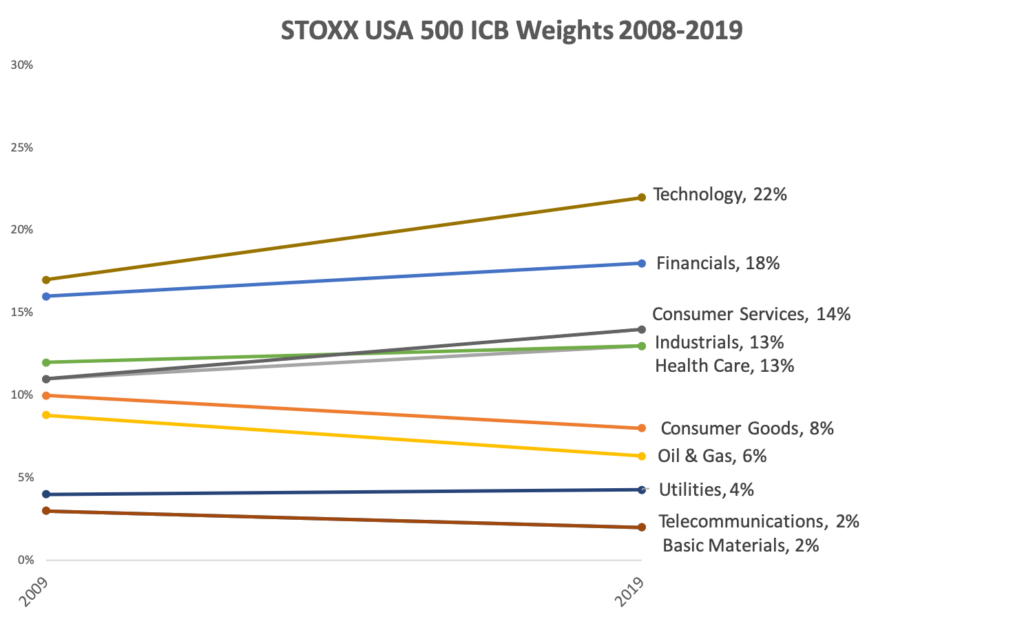
The industry allocation evolution in Europe contrasts with what happened in the US and in Asia during the period. Chart 2 shows the change in industry weights in the STOXX® USA 500 Index. Here, the main story has been the strong growth of technology stocks, led by companies including Apple, Microsoft, Facebook and Alphabet.
As a consequence, the US benchmark shows a less-diversified industry profile than does the European one. The standard deviation of the ten industries’ weights in the STOXX USA 500 Index is now higher than that of the STOXX Europe 600 Index.2 Ten years ago, the opposite was true.
Chart 2

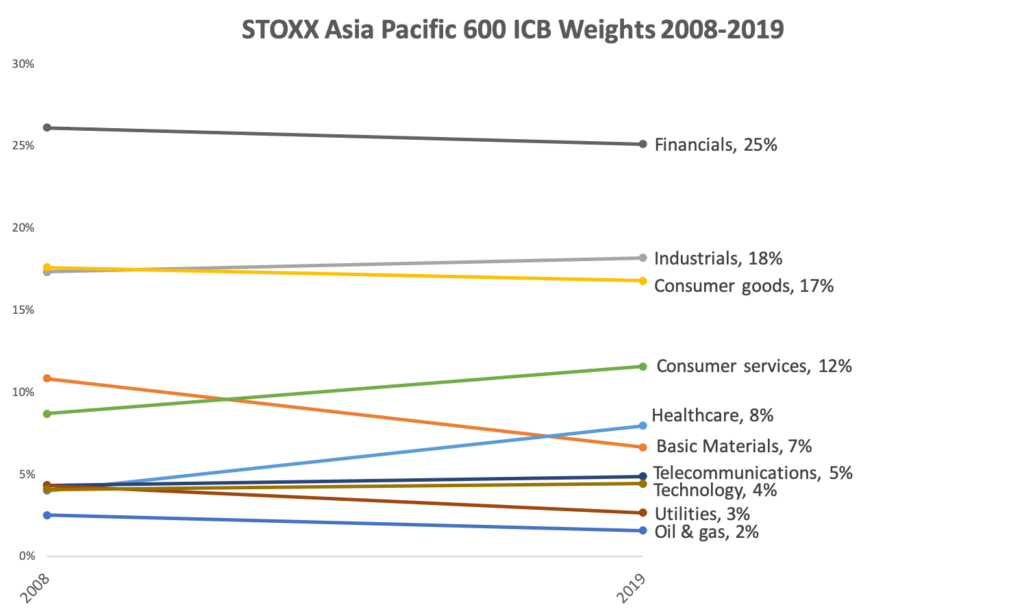
Asia shows, again, a different picture. Financial shares account for 25.1% of the STOXX® Asia/Pacific 600 Index, only one percentage point less than what they accounted for in March 2008 (Chart 3). At the other end, energy stocks represent a small 1.6% of the index.
Chart 3

While a large concentration in one single industry may increase risk, reduced representation of industries may deprive indices from potential sector drivers. In both the US and Asia, four sectors have weights under 5%. In Europe, only two: utilities (4.3%) and telecommunications (3.2%).
Comparison with other indices
In a Qontigo research paper3 last month, Ladi Williams, Product Manager at STOXX, and Anand Venkataraman, Head of Product Management, wrote that the industry allocation in European indices can bring about significant diversification benefits for overseas investors seeking to expand beyond relatively concentrated home market exposures.
The analysts compared the industry exposure of three European benchmarks – STOXX Europe 600, EURO STOXX® Index and EURO STOXX 50® Index – to popular regional and country indices elsewhere in the world. Their findings, shown in Table 1 below, confirm there is more sector diversity in Europe. Williams and Venkataraman used, in this case, the Global Industry Classification Standard (GICS) sector classification for an equal comparison.
Table 1

Unlike other markets, no industry in the European indices exceeds a 20% weight. Extreme positions can be found with financial shares in the Canadian and Hong Kong markets.
Industry allocation in STOXX indices is set to change slightly on Sep. 21, 2020 when STOXX will implement the new ICB Classification, which introduces real estate as an eleventh industry.
Industry exposure is a key risk-management consideration for asset allocators. In that sense, the evolution of sector weights in Europe in the past ten years appears as a positive development – even if it came at a price for banks’ shareholders.
Featured indices
- STOXX® Europe 600 Index
- STOXX® USA 500 Index
- STOXX® Asia/Pacific 600 Index
- EURO STOXX® Index
- EURO STOXX 50® Index
1 Industries represented in the Industry Classification Benchmark.
2 Standard deviation for the ten industries’ weights in the STOXX Europe 600 Index has fallen to 6.3% from 6.6%, while that of the STOXX USA 500 Index has increased to 7.1% from 5.2%.
3 Williams, L., Venkataraman, A., STOXX, ‘European Equity Indices for Overseas Investors,’ Nov. 2019.
