
(Updates April article to reflect the expansion of the iShares Focus ETF range to the STOXX UK Focus indices and STOXX Asia Pacific AC ex Japan Focus indices).
Heightened tensions around geopolitics and global trade have underscored how companies’ geographic revenue exposure shapes their risk profile.
In a globalized economy, a company’s country of domicile may not matter as much as where its revenues are generated. For equity investors, this means that location or listing — long traditional criteria for stock selection and portfolio construction — has become a less reliable indicator of risk.
STOXX has introduced the Focus index range to allow investors to express tactical macro views and achieve meaningful geographic diversification amid currency fluctuations, growth differentials and political risk. The suite segments key regional benchmarks by revenue exposure, creating ‘Domestic Focus’ and ‘Foreign Focus’ baskets across five major markets as detailed in Figure 1.
Figure 1: Available Focus indices
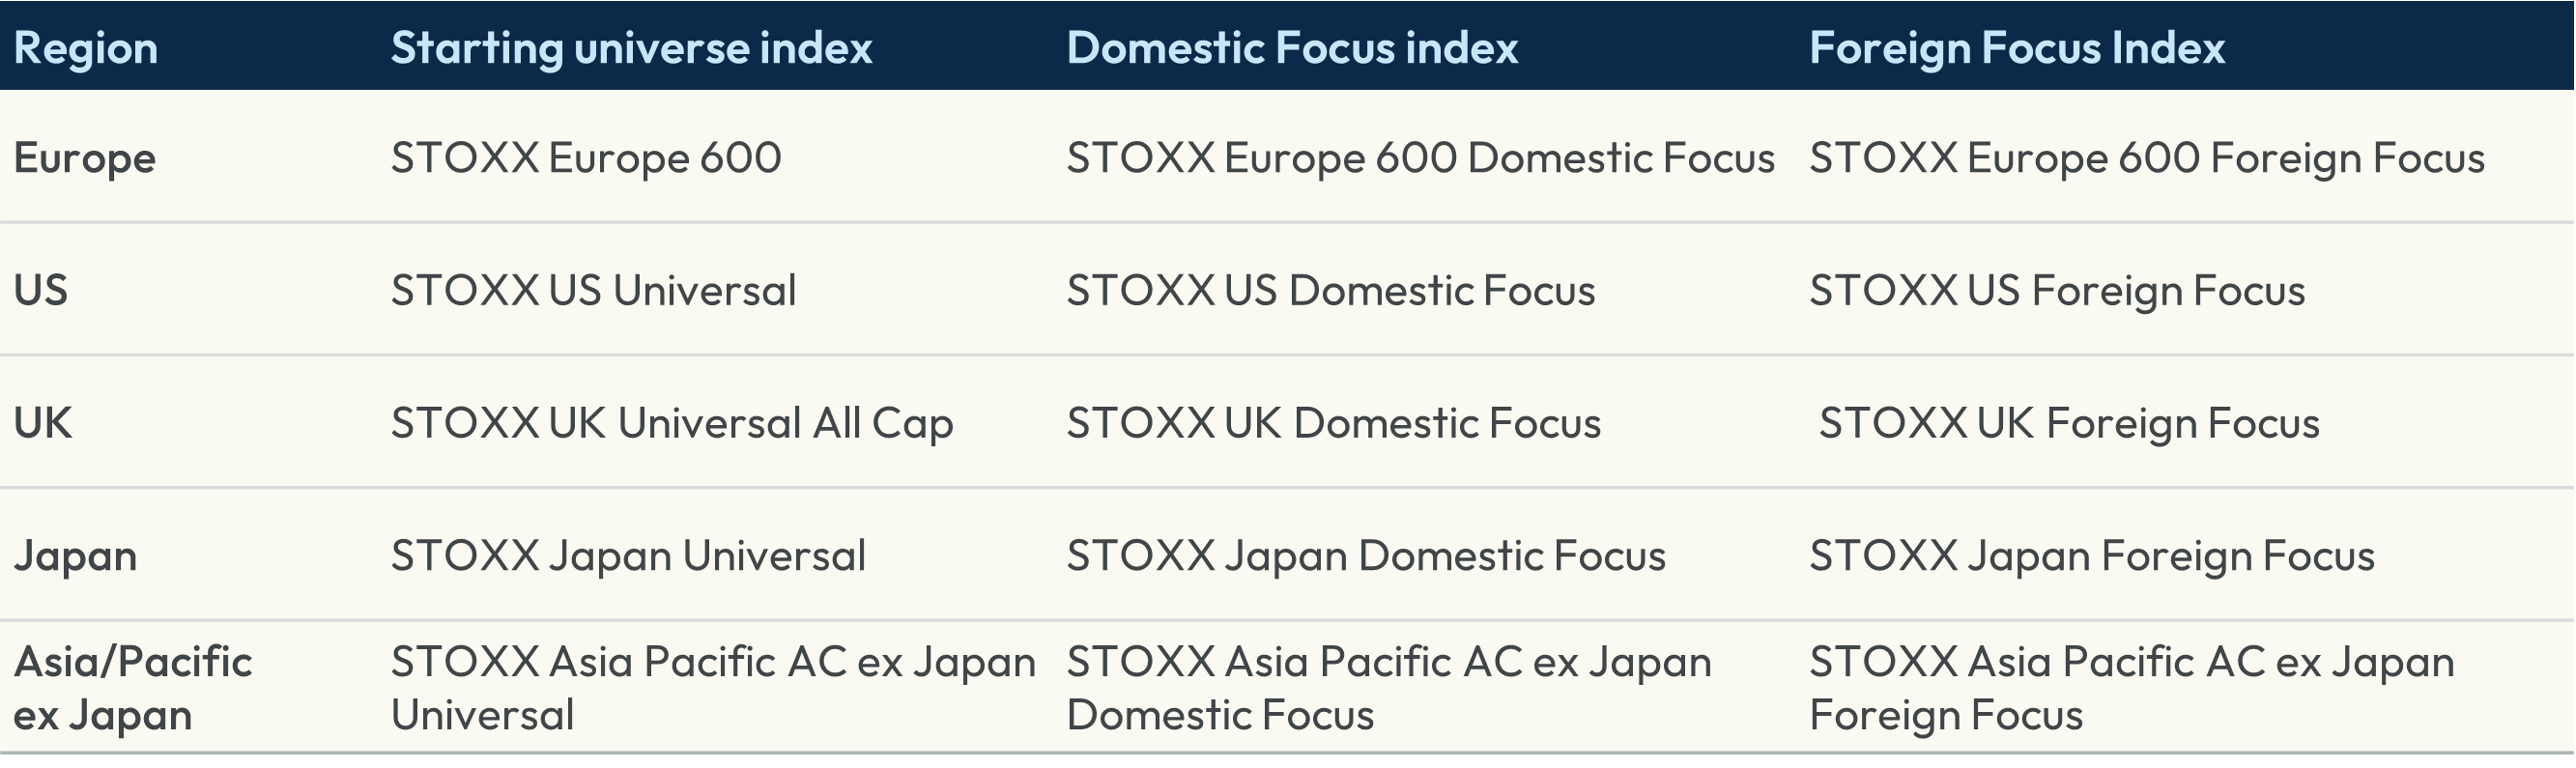
Using FactSet GeoRev data, the Domestic Focus indices include companies that derive at least 50% of sales from the target market[1], while the Foreign Focus indices exclude them.[2] BlackRock’s iShares has launched respective ETFs on the STOXX® Europe 600 Domestic Focus, STOXX® Europe 600 Foreign Focus, STOXX® UK Domestic Focus, STOXX® UK Foreign Focus, STOXX® Asia Pacific AC ex Japan Domestic Focus and STOXX® Asia Pacific AC ex Japan Foreign Focus indices, and plans to expand the offering on the remaining regions/countries.
“BlackRock is expanding client access to enable investors to better express views in a more fragmented global environment,” said Vincent Denoiseux, Head of Product Research and Innovation within iShares EMEA. “As the macro environment becomes more granular, the toolkit needs to evolve beyond traditional country classifications. Revenue-based approaches offer a clearer lens on where returns are generated and where risks lie, enabling more precise diversification in portfolios.”
Index composition
The distinction between domicile and sales exposure is relevant. According to GeoRev data, nearly half of STOXX® Europe 600 revenues — as a weighted average — are raised outside of Europe.
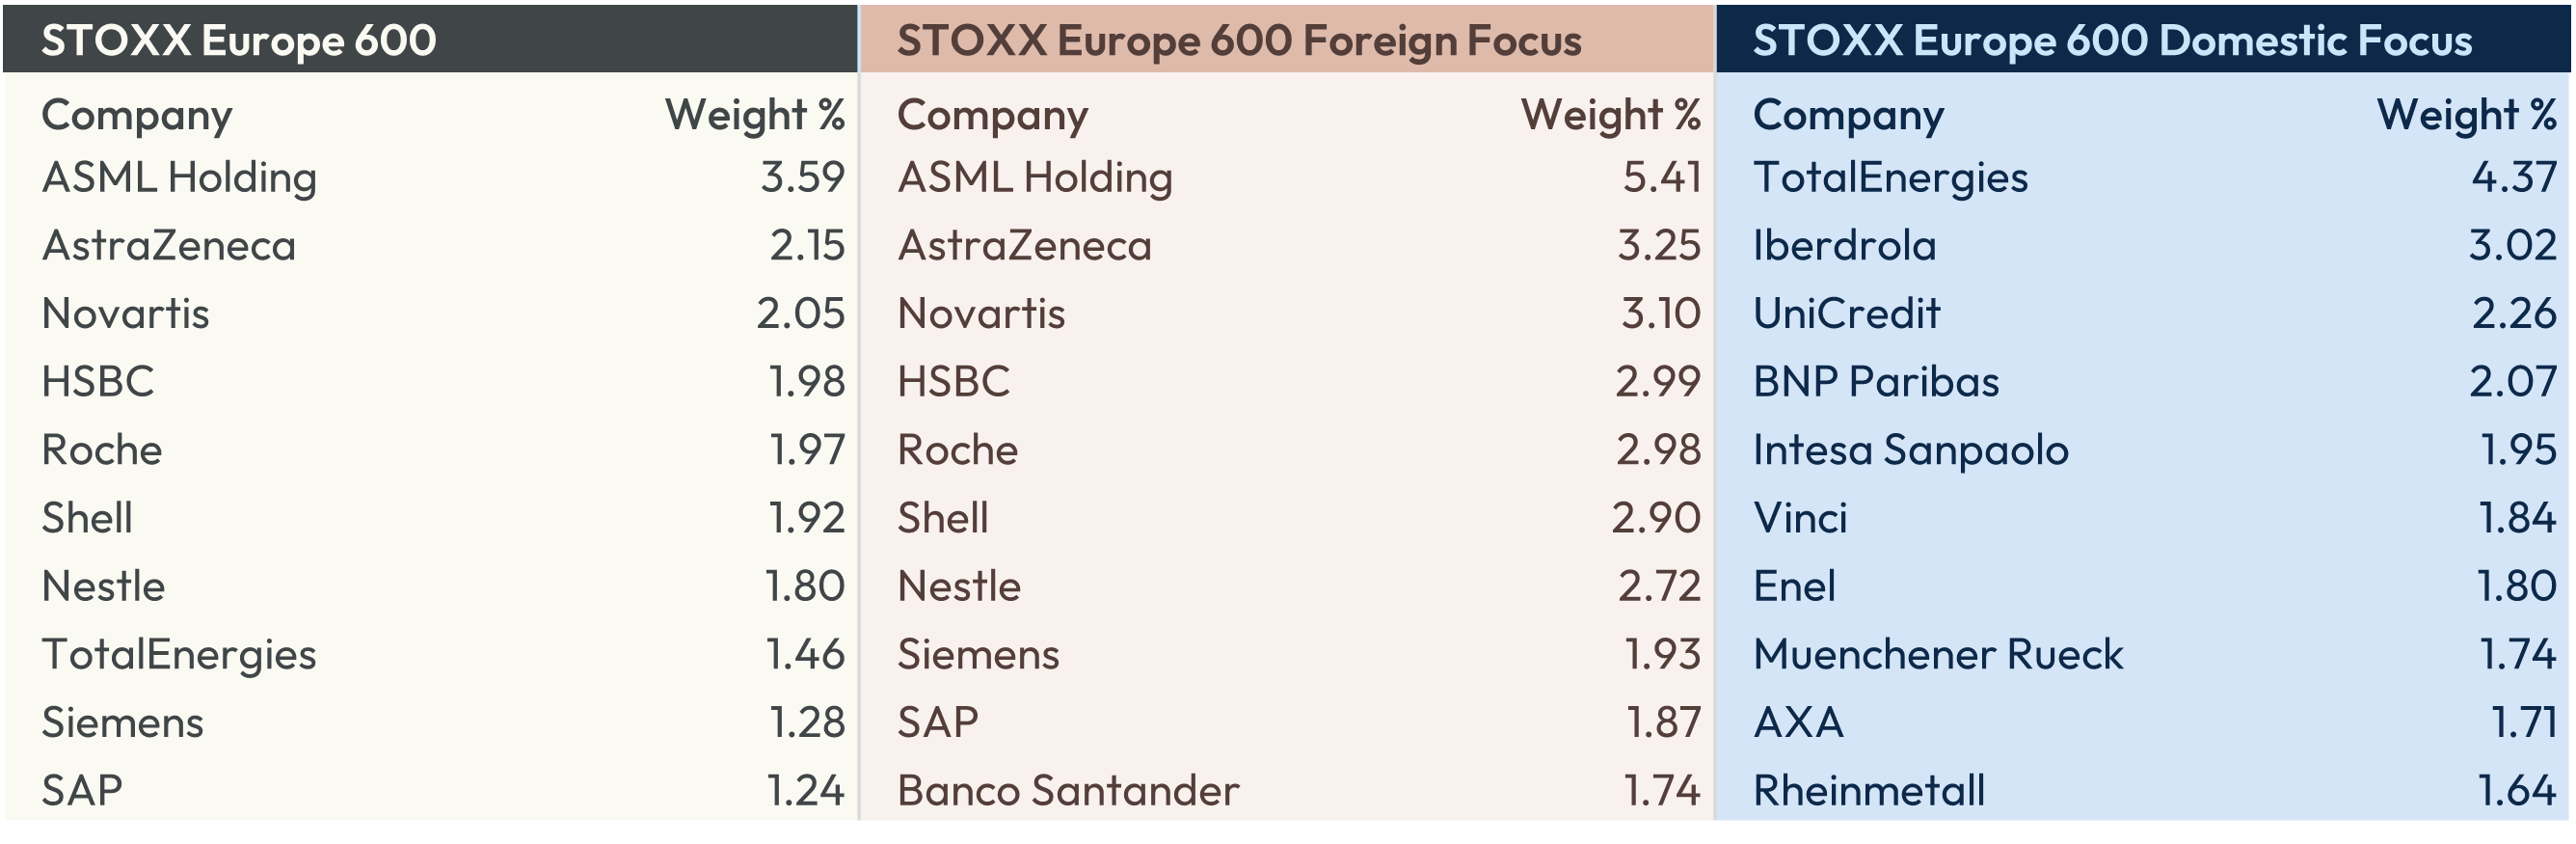
Figure 2 shows the top 10 components in the STOXX Europe 600 index and its two Focus variants. The Domestic Focus index, in particular, diverges significantly in composition from the benchmark. By contrast, the Foreign Focus index is composed of many of the same large-cap constituents, as international exposure often correlates with size, although weights are more concentrated among those bellwether exporters.
Figure 2: STOXX Europe 600 and Focus variants — top 10 holdings
Shifting international trade backdrop
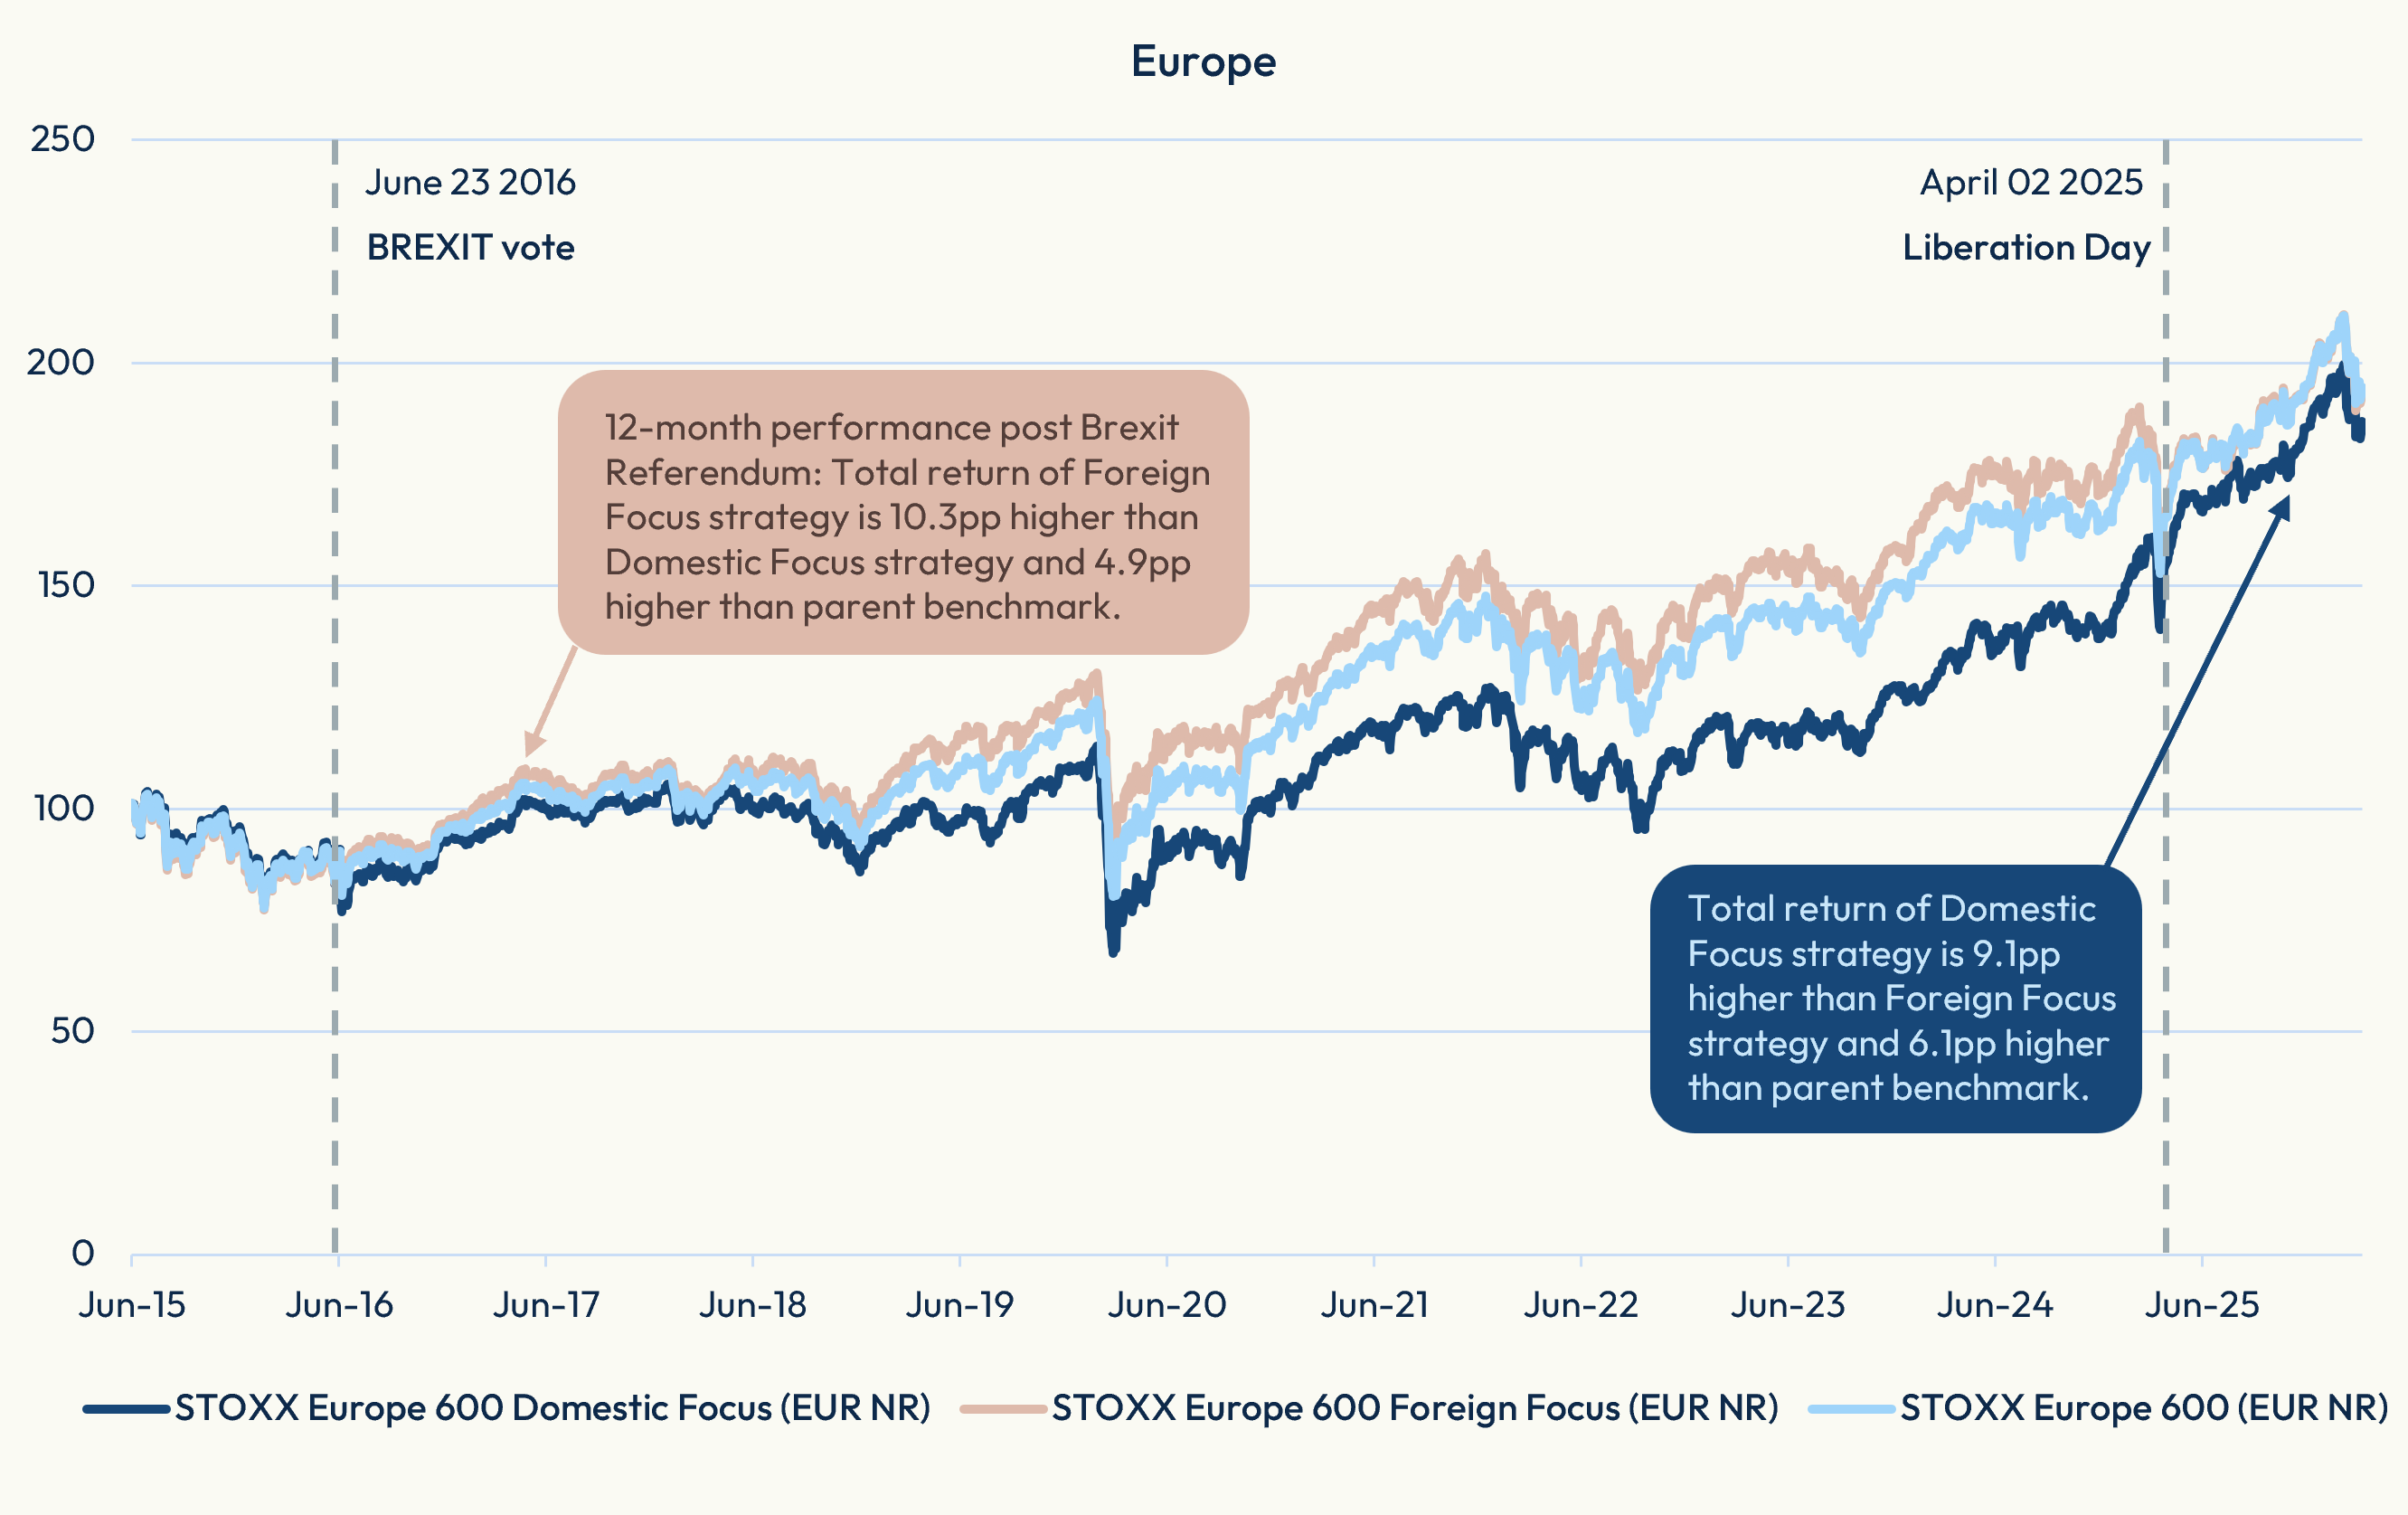
Market performance in recent years demonstrates the effect of genuine geographic diversification based on revenue sourcing. Figure 3 shows the backtested performance of the European benchmark and its two Focus variants.
Following the Brexit vote and during the COVID-19 years, the STOXX Europe 600 Foreign Focus index outperformed both its Domestic Focus counterpart and the benchmark, as investors favored European companies with overseas revenues to offset weak European domestic growth. However, the trend reversed during April 2025’s US tariffs announcements, causing investors to turn more bullish on European Strategic Autonomy[3] programs and prioritize companies less exposed to exports.
Since April 2 last year, the STOXX Europe 600 Domestic Focus has risen 17.6%, compared with an 8.5% advance for the STOXX Europe 600 Foreign Focus index and gains of 11.5% for the benchmark.[4]
Figure 3: European focus and domestic sales baskets performance
Outperformance of 22 percentage points
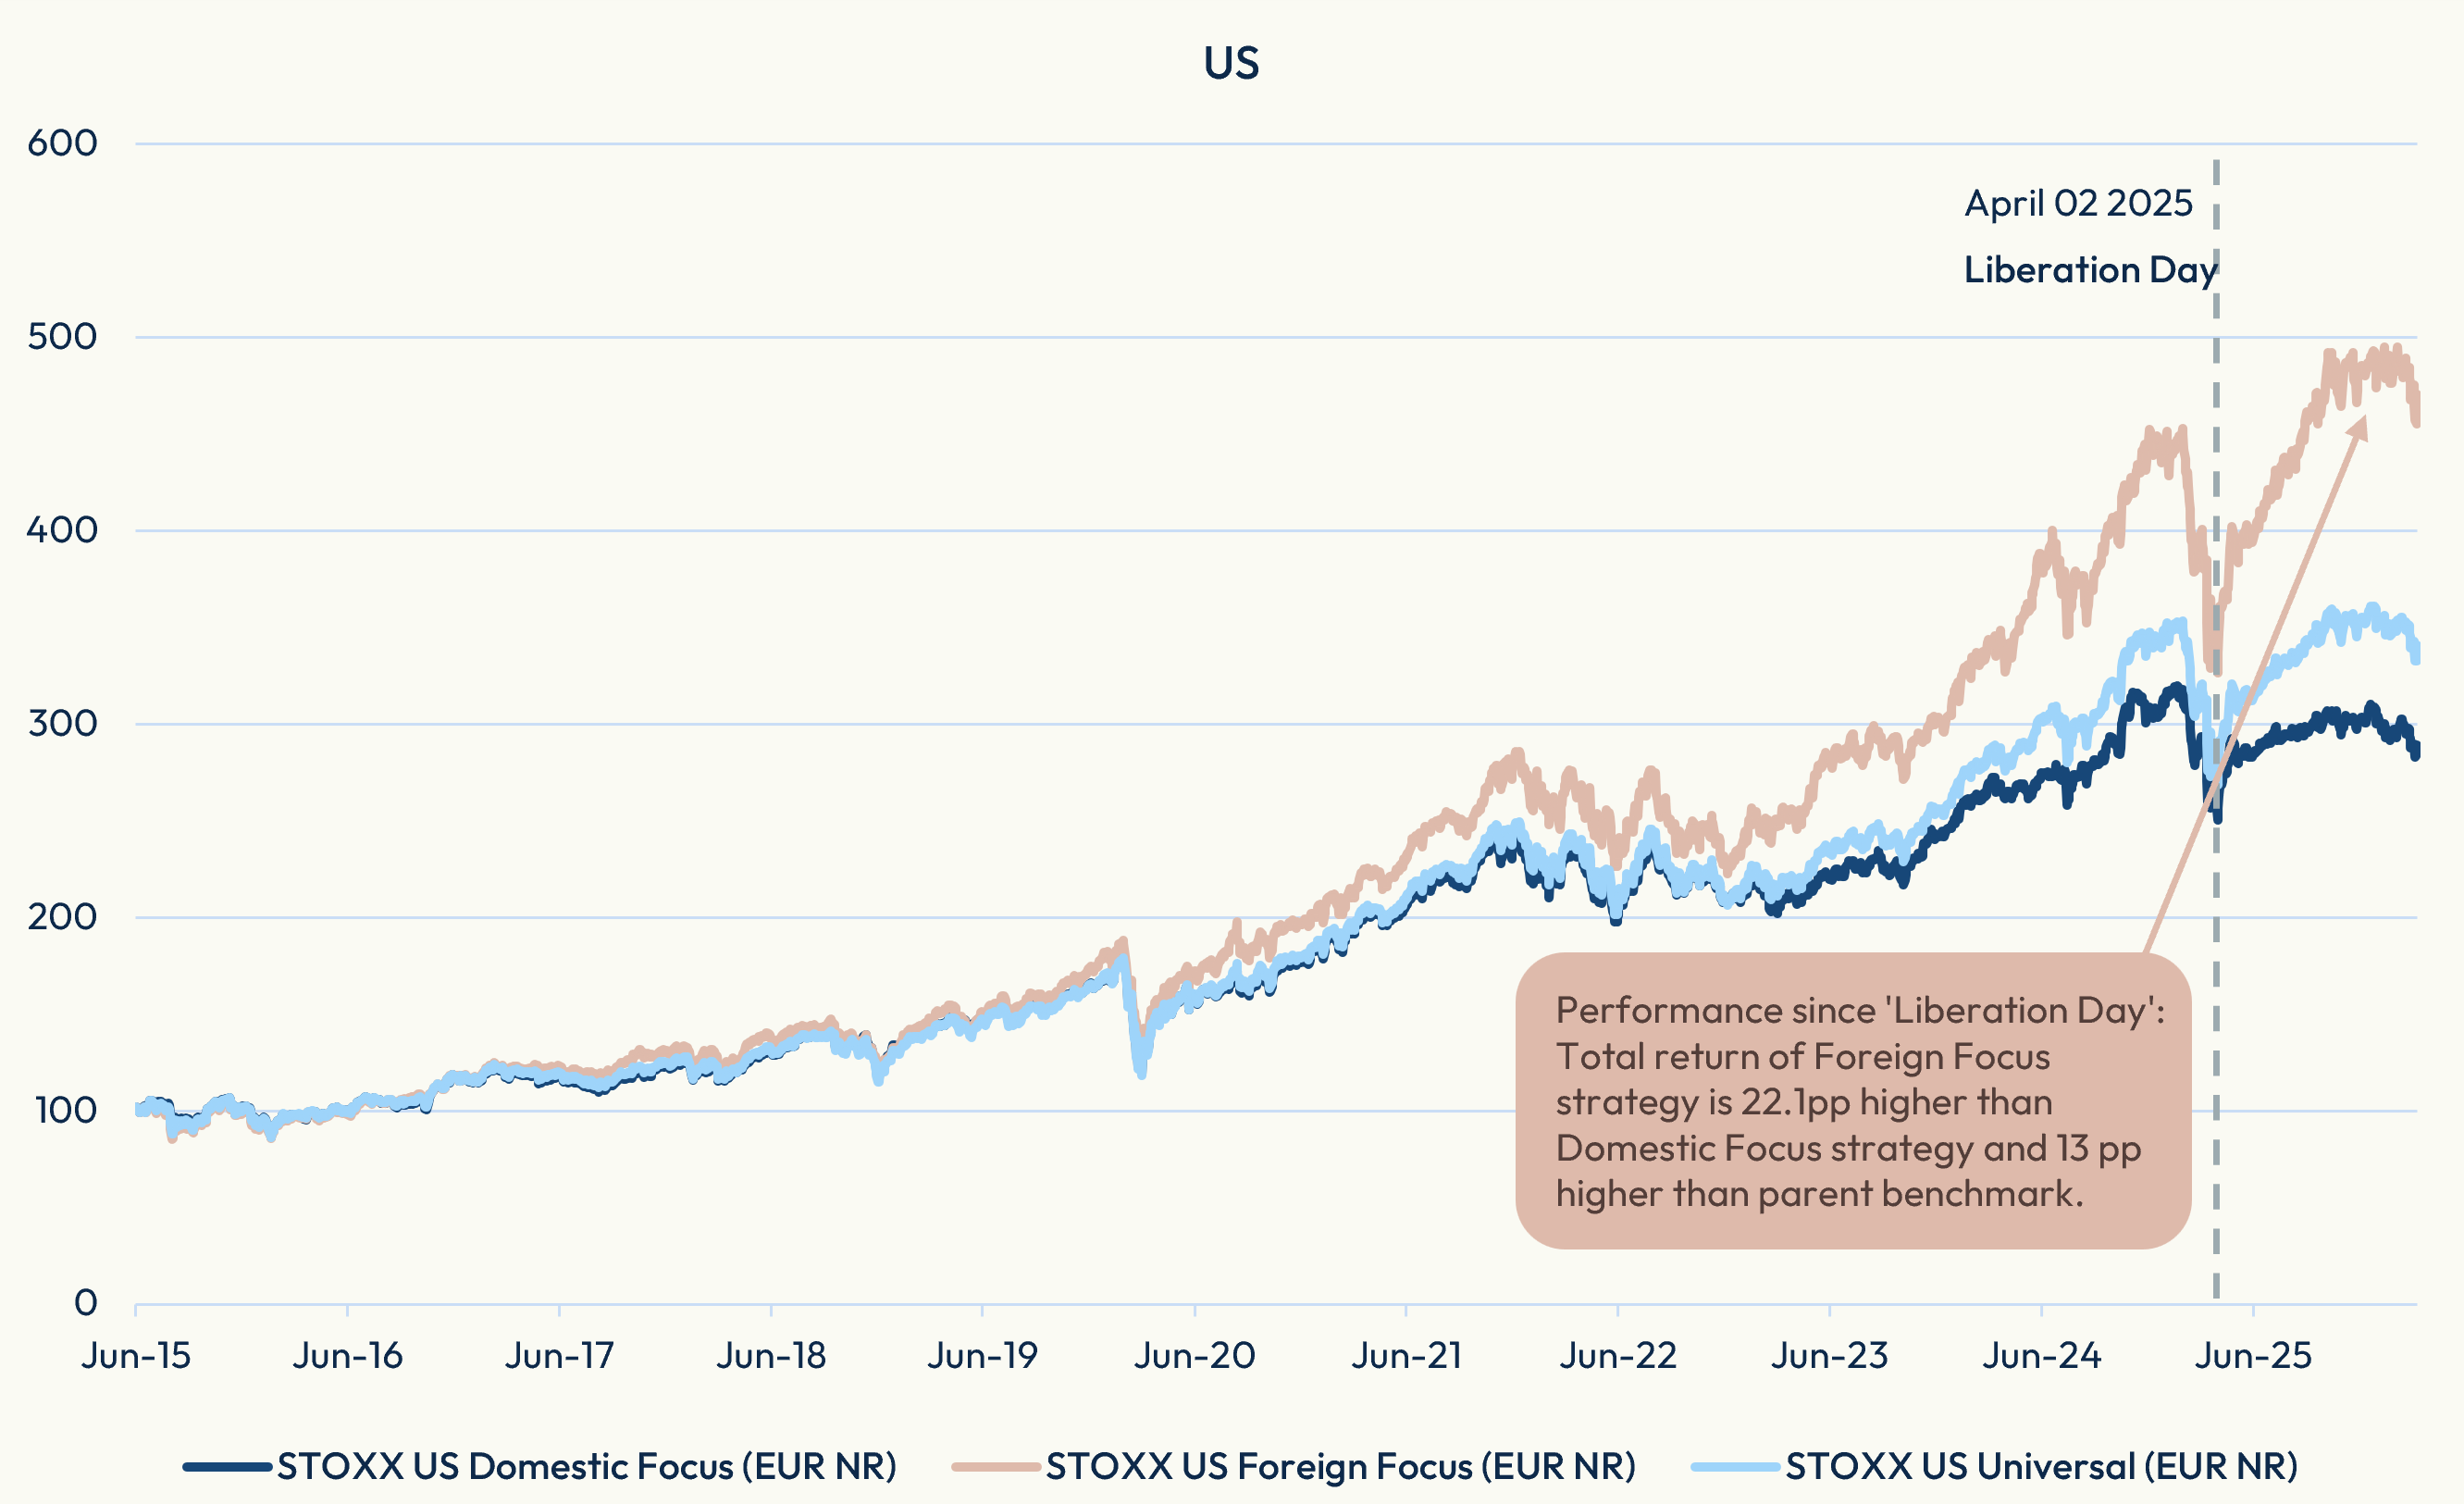
The US market shows an even wider divergence between domestic- and foreign-focused companies over that period. Since April 2, 2025, the STOXX® US Foreign Focus index has climbed 22.2%, compared with a 0.1% gain for the STOXX® US Domestic Focus index and a 9.2% advance for the STOXX® US Universal parent index (Figure 4).[5]
Figure 4: US Focus indices
Shifting leadership in Asia
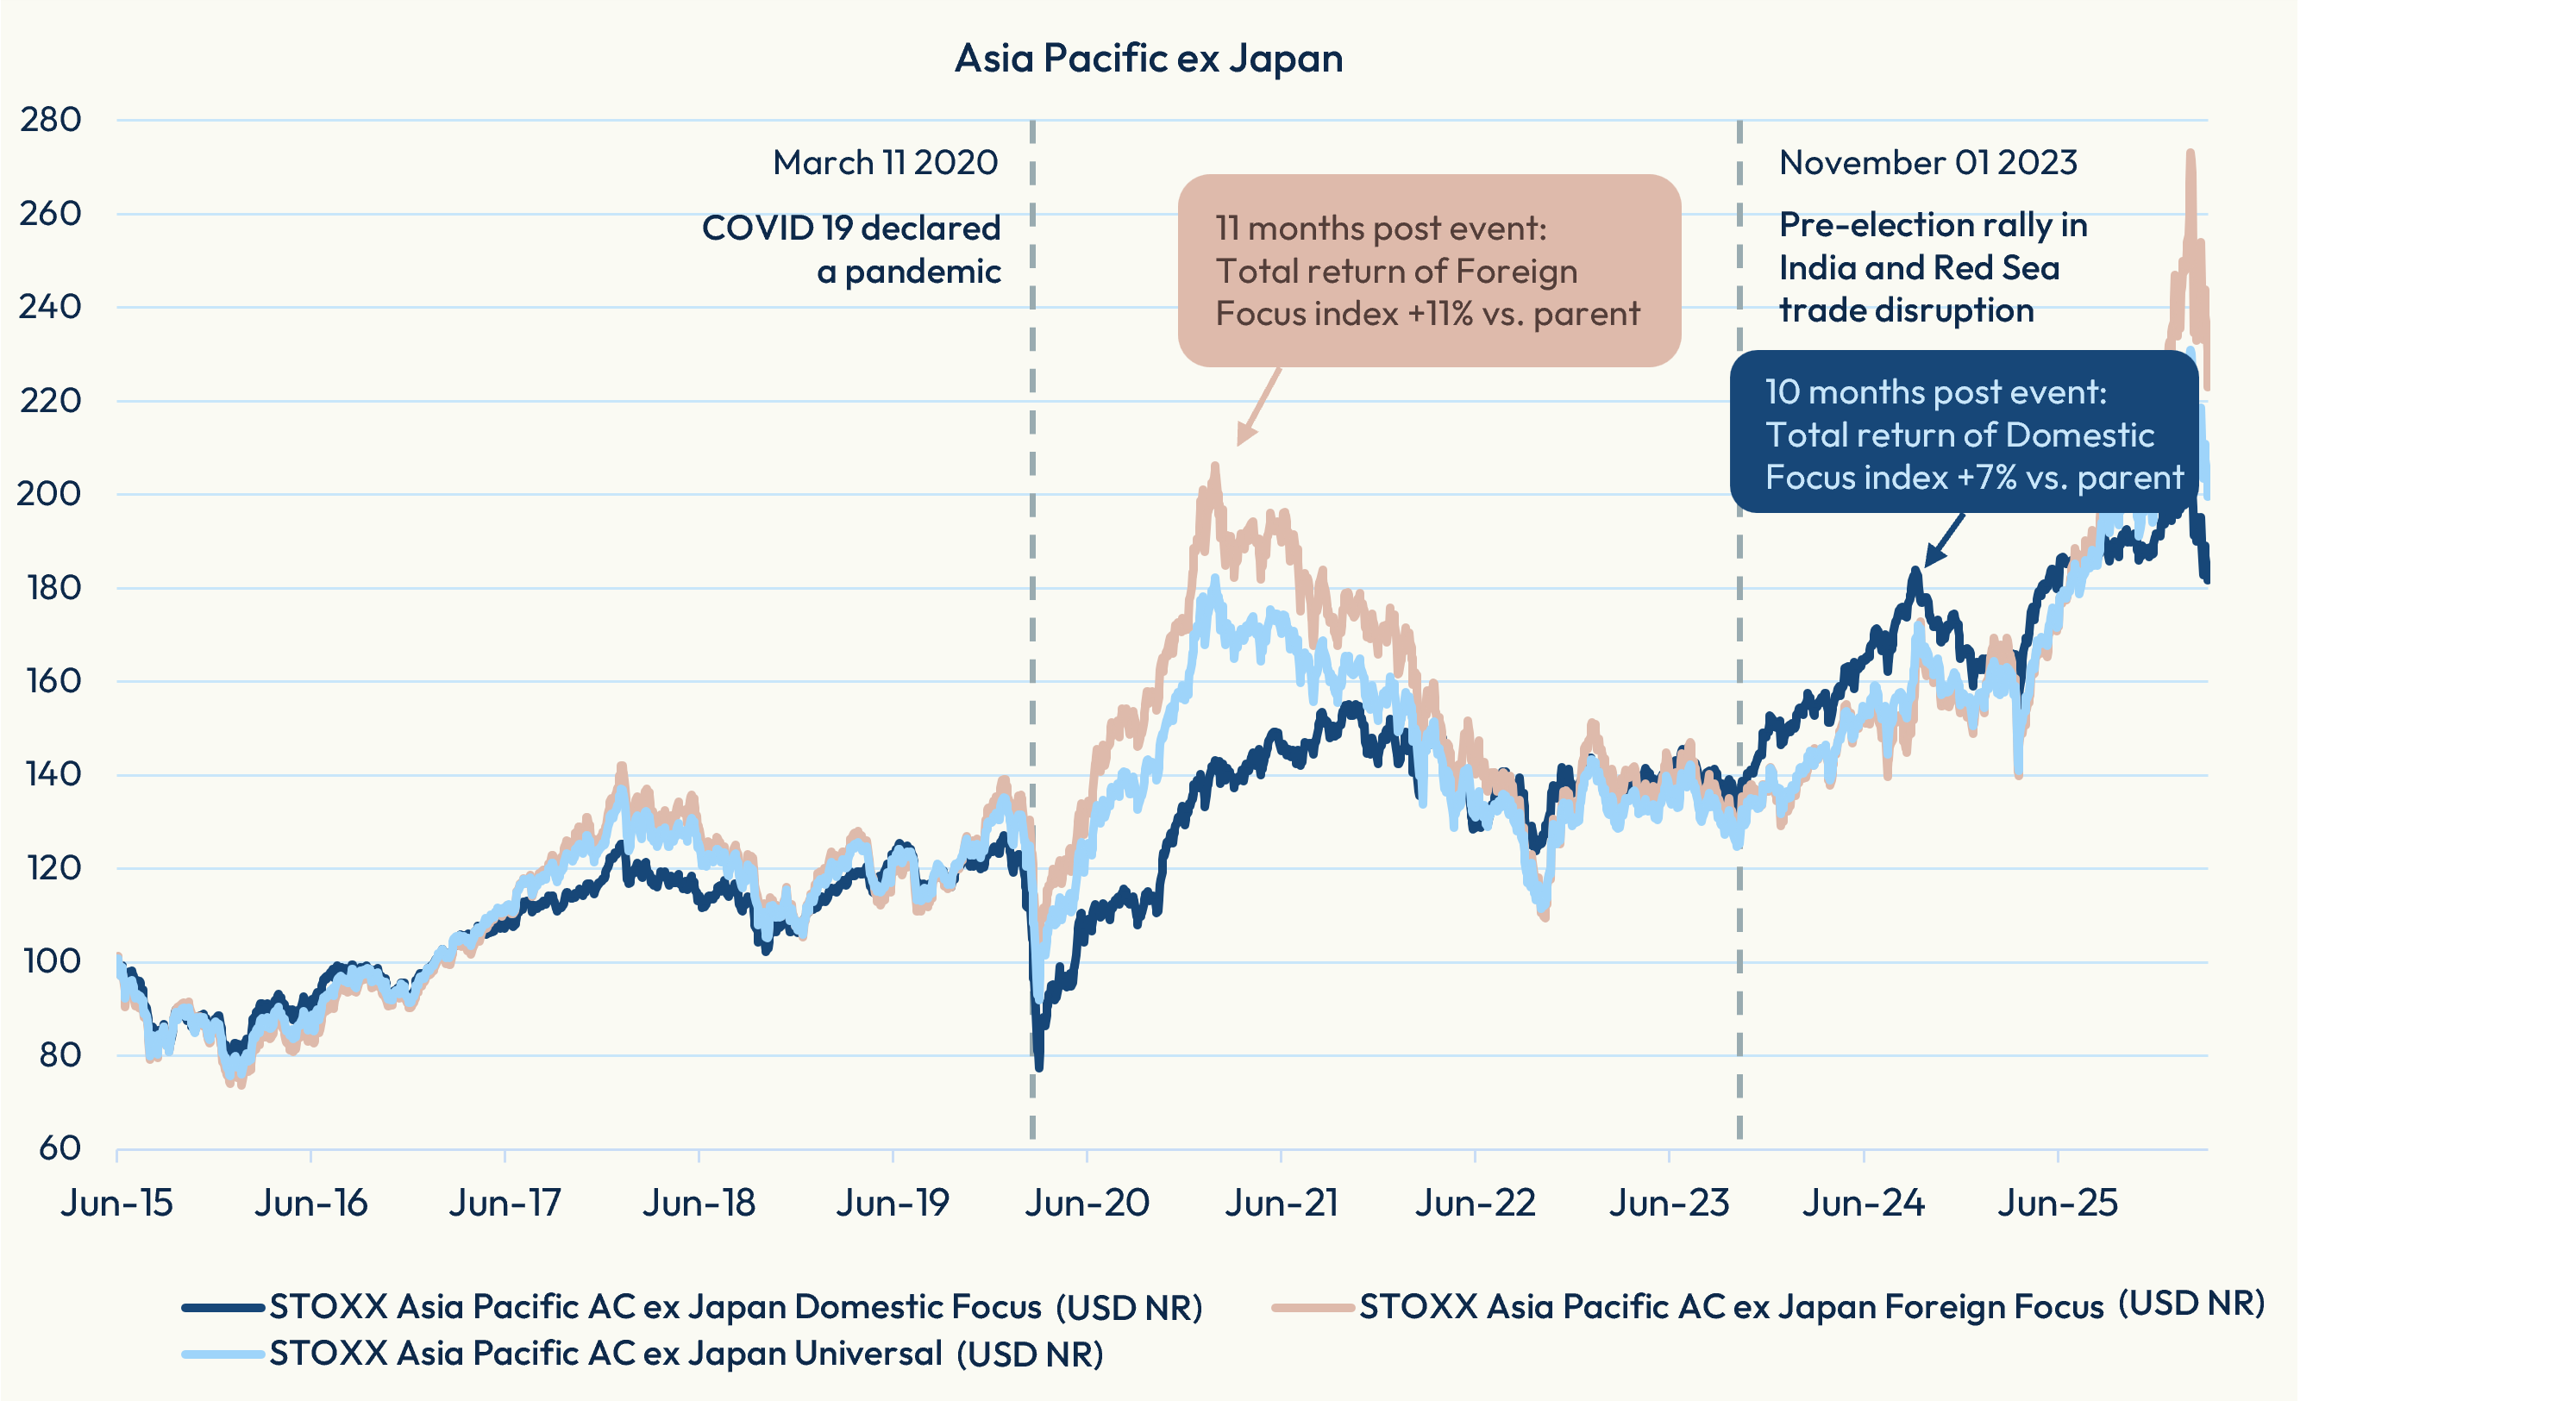
The recent expansion of iShares’ Focus ETF range to Asia Pacific ex Japan reflects a similar pattern: market segments across the region respond to changing conditions in distinct ways, depending on where they generate their revenues.
The STOXX Asia Pacific AC ex Japan Foreign Focus index outperformed its parent benchmark by 11 percentage points over the 11 months following the declaration of COVID-19 as a pandemic in March 2020 (Figure 5).[6] More recently, the STOXX Asia Pacific AC ex Japan Domestic Focus index outperformed its parent benchmark by 7 percentage points over the 10 months from November 2023, amid India’s pre-election rally and disruption to trade through the Red Sea.
Figure 5: Asia ex Japan Focus indices
Reshaping the global landscape
The STOXX Focus indices arrive at a particularly relevant moment for global equity investors. Geopolitical tensions — from conflict involving Iran and its impact on oil markets to strains between the US and NATO allies — are reshaping the global landscape and triggering a broader reassessment of trade and international relations. In this environment, traditional geographic classifications may no longer fully capture where risks truly lie. Investors may therefore need a more nuanced lens, one that reflects the evolving sources of corporate exposure across borders.
[1] Domestic Revenue is defined as revenue generated from the region of the parent index.
[2] Components are weighted by free-float market capitalization and are not subject to weight capping.
[3] European Strategic Autonomy is the European Union’s pursuit of increased independence in defense, energy, digital technology, and critical supply chains to act as a self-standing global actor. See European Papers.
[4] Net returns in EUR through March 31, 2026.
[5] Net returns in EUR through March 31, 2026.
[6] Net returns in USD.