
By Hamish Seegopaul, Global Head of Index Product Innovation at STOXX.
Your index is up 2% today. You’re happy, but you may have some questions. Was there a macro event? Was it idiosyncratic stock performance? Was there a dominant sector or factor driver? Something else?
Why stock moves happen is a common discussion, but when they happen… much less so. At the end of the trading session? Midday? Before the open? Does it even matter? We take a closer look.
For the EURO STOXX 50® index (SX5E), which tracks the Eurozone’s largest Supersector leaders, the underlying cash equity markets are open 09:00-17:30 CET. Using STOXX calculations, we look at the average daily SX5E return over the last 12 years, and break it down into several intervals: previous day’s close to 9:00, then every half-hour increment up to 17:00, and finally 17:00 to market close. This is displayed below as a “waterfall” chart, where each successive bar is added up to the running total, and ultimately arrive at the close-to-close return. We show two time periods: starting in 2013 and starting in 2022.
Figure 1: Daily return breakdown
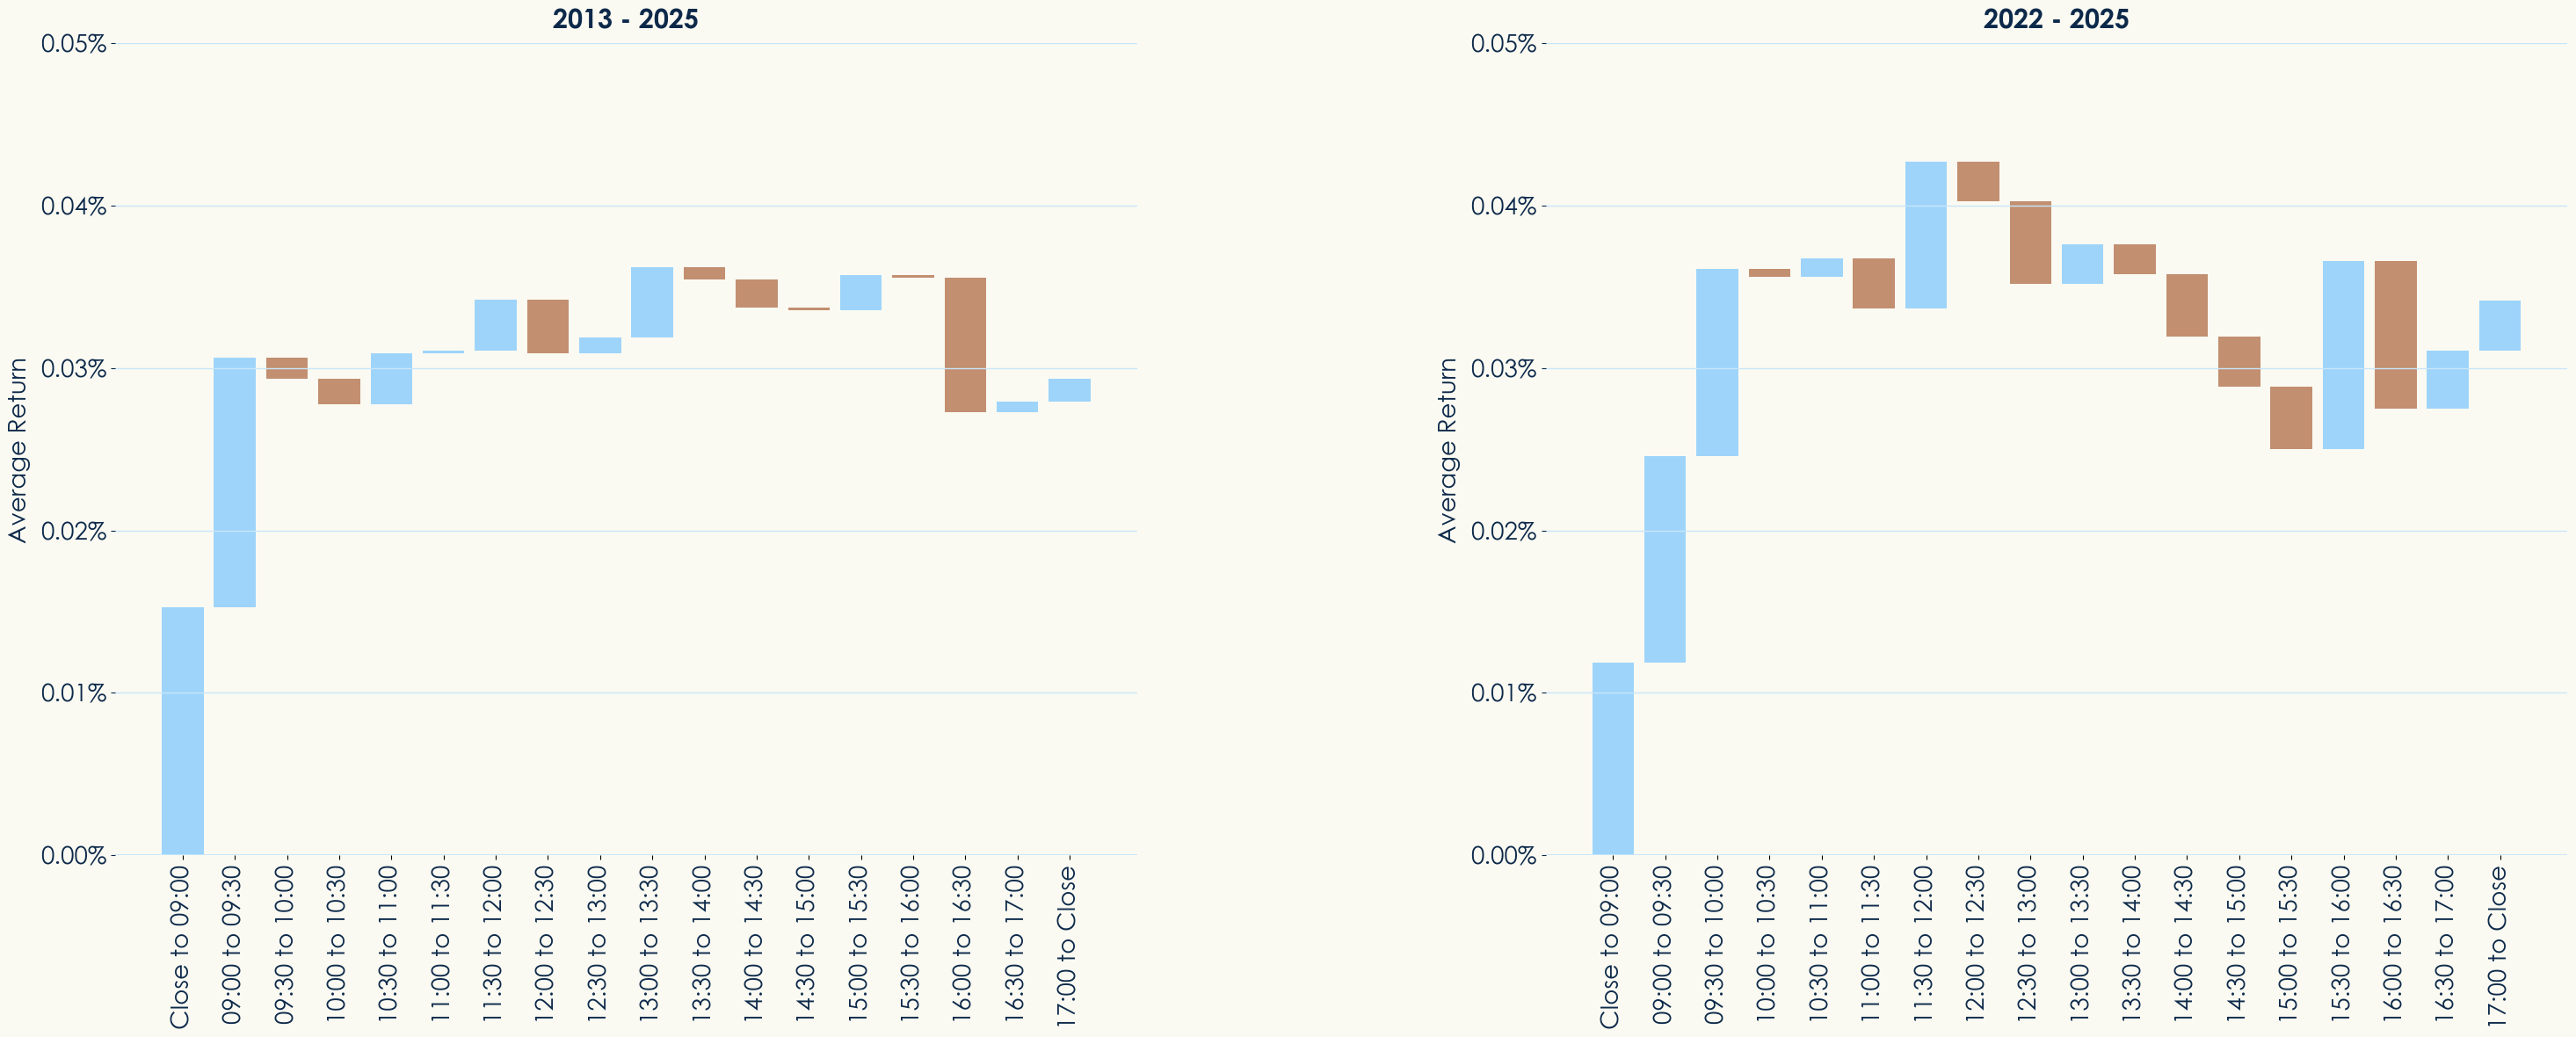
If you have not seen a study like this, or if you are just a fan of the efficient markets hypothesis, you may find the results surprising. The average daily return (the height of the final bar) is around 3 basis points (bp) for the full period, and slightly higher for the past few years. However, the return at 09:00 (vs. the previous close) is already 1-2bp and by 10:00 it is 3-4bp, meaning much of the daytime trading — over a longer horizon — looks like “noise.”
This phenomenon is often referred to as “the overnight effect” or “overnight drift[1],” and has been called the “grandmother of all market anomalies[2].” Research has found evidence of price appreciation during market closure across geographies (particularly in the US), asset classes, and both single securities and portfolios. Several theories for its presence exist: an overnight risk premium, activity in derivatives, timing of information flow, retail activity on the open, inventory management — but there is no settled science.
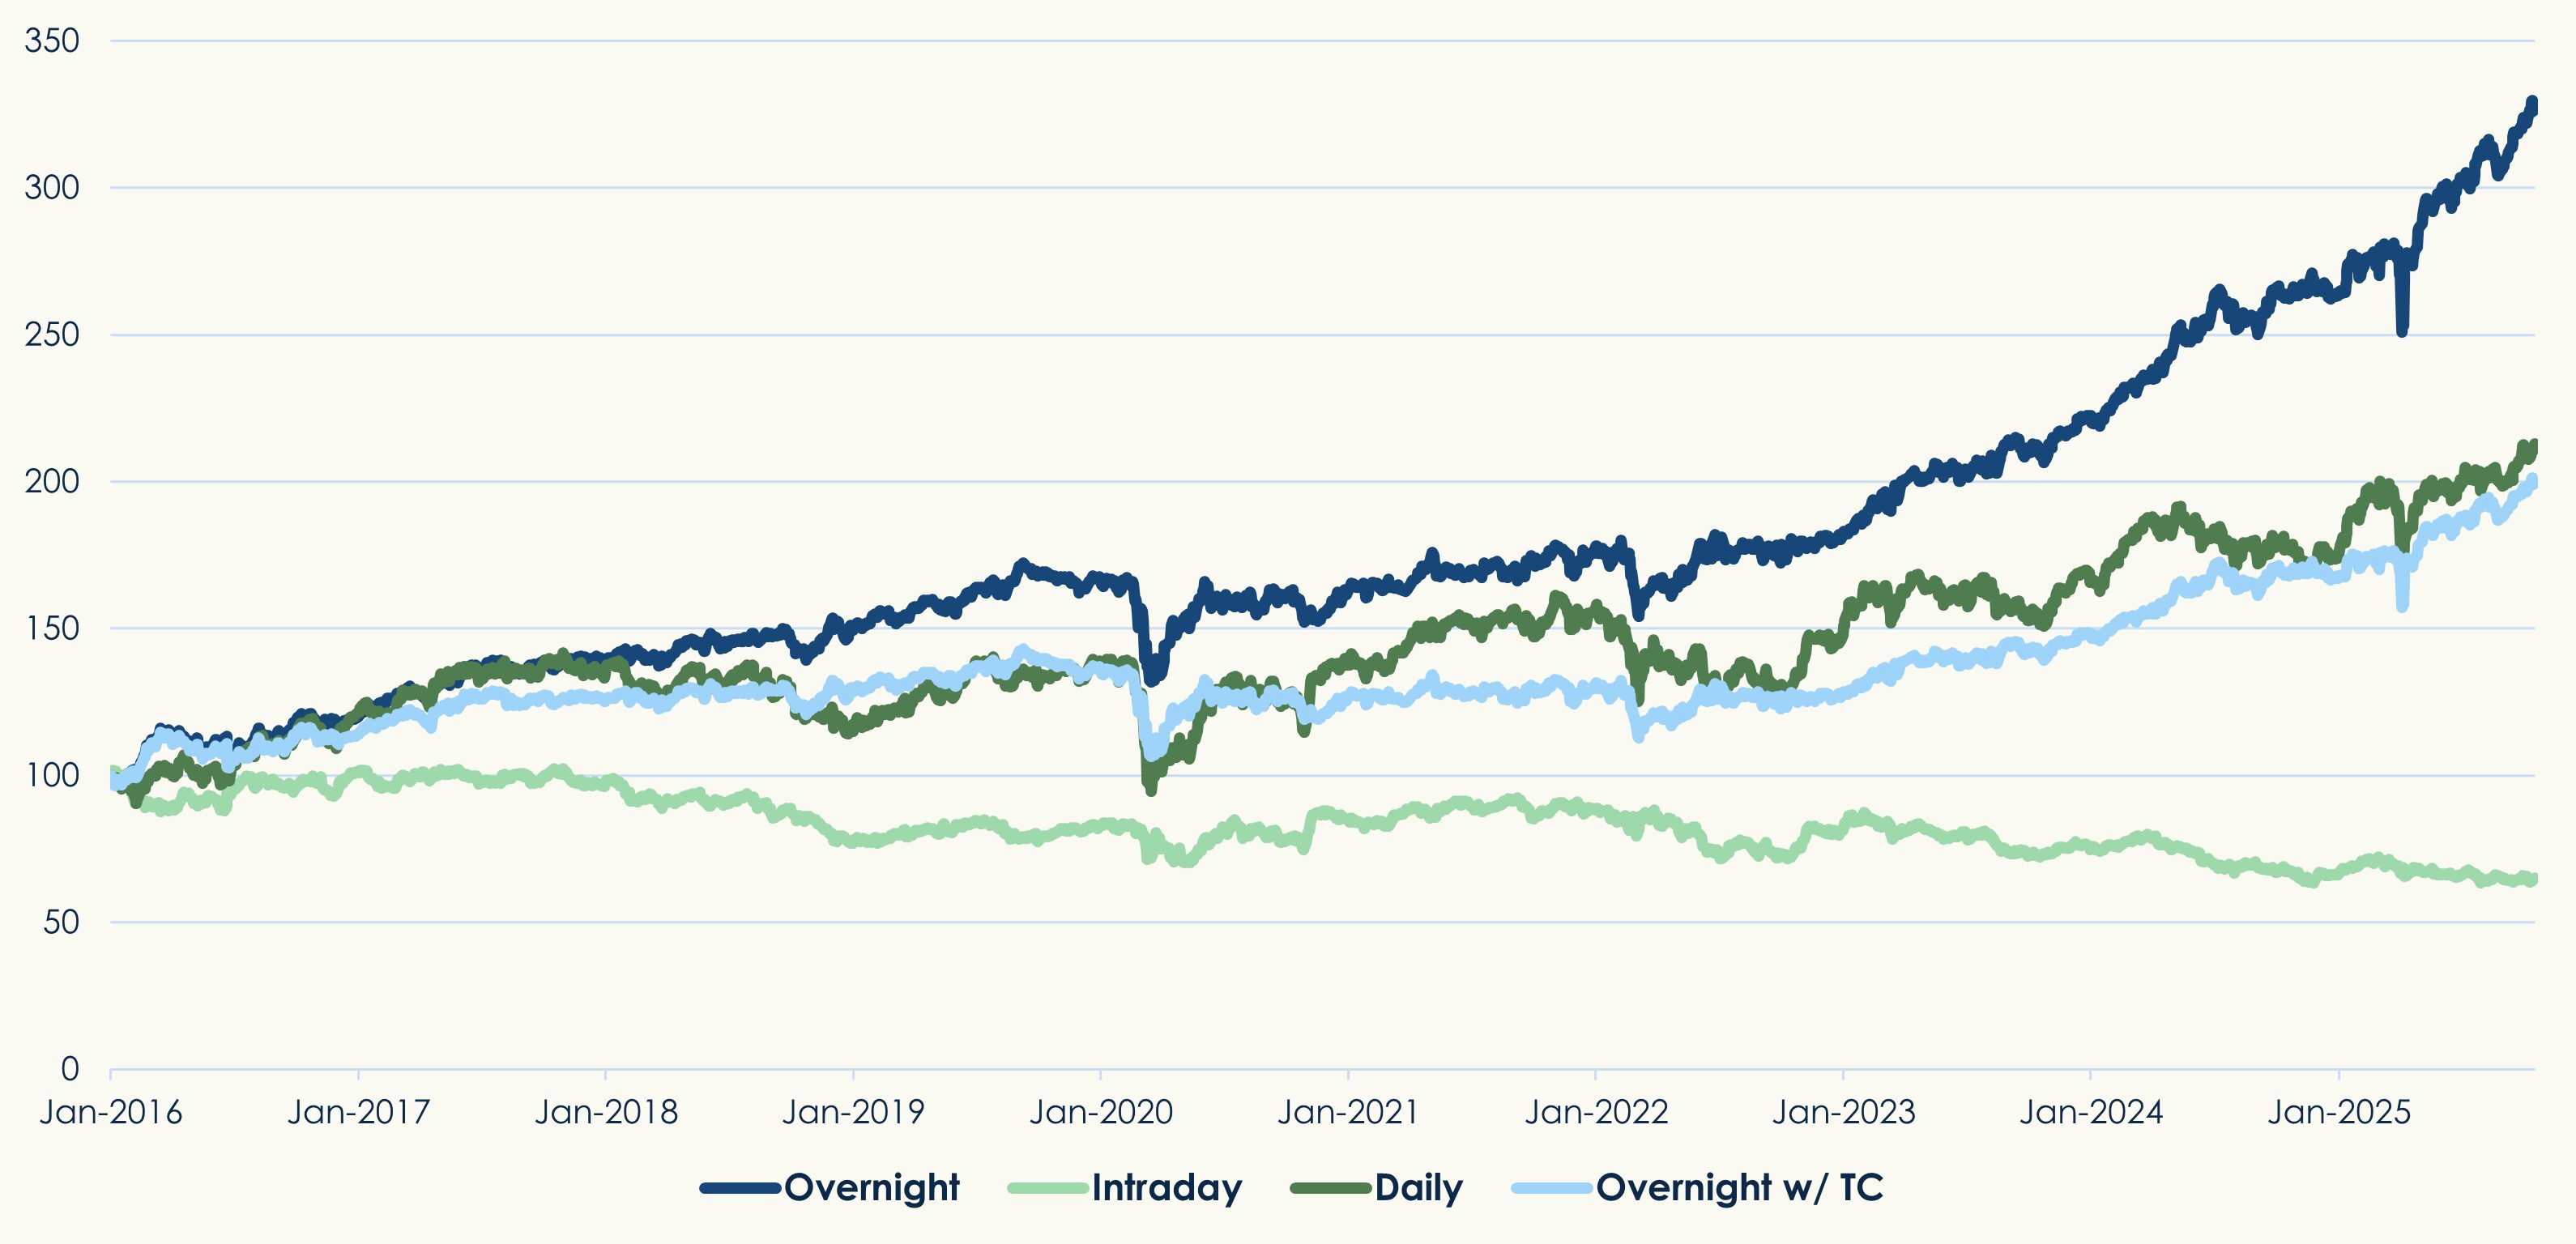
We can observe this phenomenon in index trackers as well. Figure 2 shows the performance of the popular iShares Core EURO STOXX 50 UCITS ETF EUR (EUE). While the ETF returns about 8% annually over the period studied, overnight returns (previous close to open) are 12.9% p.a., leaving the intraday performance (open to close) negative, at -4.3% p.a. However, we also add a series showing these stellar overnight returns once you factor in nominal trading costs (1bp per trade). In this case, the overnight performance falls to 7.3% p.a., less than the ETF itself. Free lunches remain few and far between.
Figure 2: iShares Core EURO STOXX 50 UCITS ETF EUR — Interval returns
We recently wrote in a paper about the importance of considering timing risk, and introduced a metric to help quantify timing risk over long horizons. In this brief article, we seek to illustrate the importance of timing over short horizons as well. The takeaways are similar. While the rewards for timing are very real, for most of us who are not professional investors, we may be better off just sleeping on them.
[1] Boyarchenko, N., Larsen, L. C., & Whelan, P. (2023). The Overnight Drift. The Review of Financial Studies, 36(9), 3502–3547.
[2] Haghani, V., Ragulin, V., & Dewey, R. (2024). Night Moves: Is the Overnight Drift the Grandmother of All Market Anomalies? Journal of Investment Management, 22(2), 68–80.