
Timing investments is notoriously difficult. Yet despite the empirical evidence of its challenging nature for individual investors, the potential rewards for anticipating market moves are real.
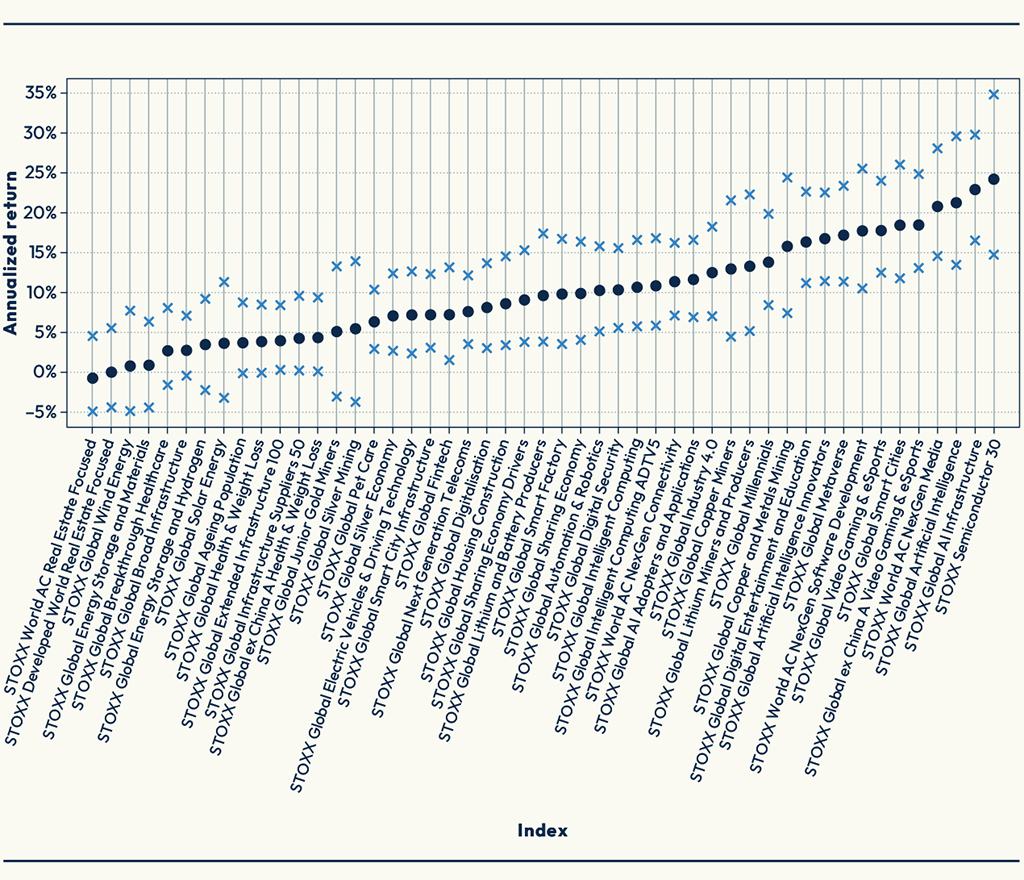
Figure 1 shows in black dots the annualized performance of STOXX Thematic indices from 2019 to 2024. The blue crosses represent adjusted index returns when the year’s best or worst days are excluded.
In the case of the best-performing index, the STOXX® Semiconductor 30, its annualized return of 24% over the period jumps to 35% if an investor had held the index while avoiding its worst trading session each year. Conversely, the return drops to an annualized 15% if the investor had consistently missed each year’s best day for the index. While a strategy that aims to exclude a single day may not be realistic, it is nevertheless instructive in the potential risks and rewards.
Figure 1: Annualized return range with best or worst days per year removed
The table comes from a new STOXX whitepaper that contributes to the research on market timing by attempting to quantify the timing risk associated with different portfolios. The author, Hamish Seegopaul, Global Head of Index Product Innovation at STOXX, argues that while a portfolio’s volatility may hint at how strongly returns can rely on a small sample of days, it neither provides a complete picture nor adequately illustrates market timing risk.
Instead, Hamish proposes a new metric — the tail-implied volatility (TIV) spread — that can help investors estimate the impact of a portfolio’s best days, and potentially gain clarity on their risks.
The TIV spread
The TIV spread seeks to capture the difference between a theoretical historical volatility — based on what the best one-day returns per calendar year imply — and actual realized volatility.
“In other words,” writes Hamish, “we aim to capture the difference between expectations and reality.”
“One can think of the TIV spread as something akin to a ‘volatility bump’ that an options trader can use to adjust their modeled option prices,” Hamish says. “The higher the TIV spread, the more influenced the historical returns were by the best day per year” after controlling for volatility. “And thus the higher risk an investor may be exposed to when trying to time an investment.”
The TIV spread allows investors to compare investments from the standpoint of timing risk. An index with a historical volatility of 15% may seem like less of a risk to time than one of 20%. The TIV spread aims to assess whether this was historically the case. The metric is low on complexity and high on intuition, and is straightforward to calculate.
Comparing indices’ market timing risk
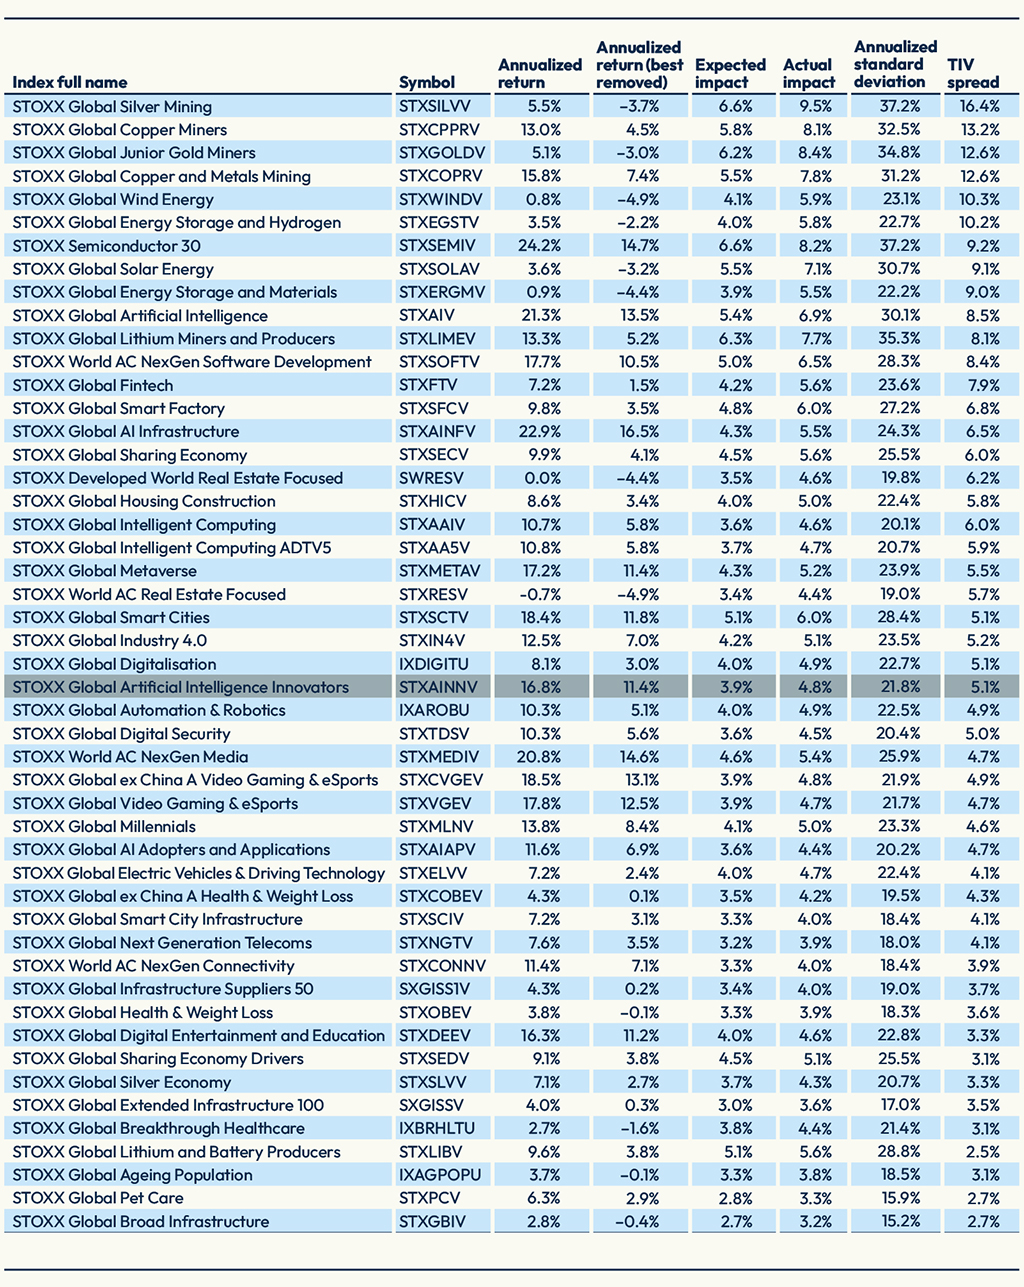
Looking again at the STOXX Thematic indices in the period 2019-2024, Figure 2 displays a ranking of the indices by TIV spread, with those at the top showing that their overall performance is more influenced by single strong days than their historical volatility levels would suggest. An investor seeking to time the market would have a higher risk of reducing their returns, by potentially missing those days. The STOXX® Global Silver Mining had the highest TIV spread, at 16.4%, while the STOXX® Global Broad Infrastructure had the lowest, at 2.7%.
Figure 2: STOXX Thematic indices’ risk/return and TIV spread
Importantly, the study shows that the TIV spread does not depend on the original volatility or return levels.
“As one might expect, the issue of returns being less than perfectly normally distributed is not a novel one, and the investment/statistics community already has an array of metrics to help navigate this,” writes Hamish. “While finance industry professionals may live and breathe some of these, an average individual investor is unlikely to do so. The TIV spread can bridge the gap in helping understand the profile of historical returns without a crash course in statistics, balancing simplicity and insight.”
We invite you to download the whitepaper to read about the calculation behind the TIV spread and explore the study’s findings.