
Paying for insurance can seem expensive — until it is needed.
That axiom holds in equity markets. Buying protection against market volatility was costing portfolios this year, until the August 5 market sell-off reverted that equation in only one session.
The EURO STOXX 50® Volatility-Balanced index jumped 8% that day as concern about an economic slowdown in the US and an increase in Japanese interest rates rattled financial markets. The EURO STOXX 50® fell 6.2% between August 1 and August 5.
The EURO STOXX 50 Volatility-Balanced index combines a base investment in the EURO STOXX 50 benchmark with a variable allocation to equity volatility through the EURO STOXX 50® Volatility (VSTOXX®) Short-Term Futures index. The Balanced strategy dynamically allocates weight away from equities and into volatility futures in times of market stress, with each asset’s weight determined by the prevailing volatility environment.
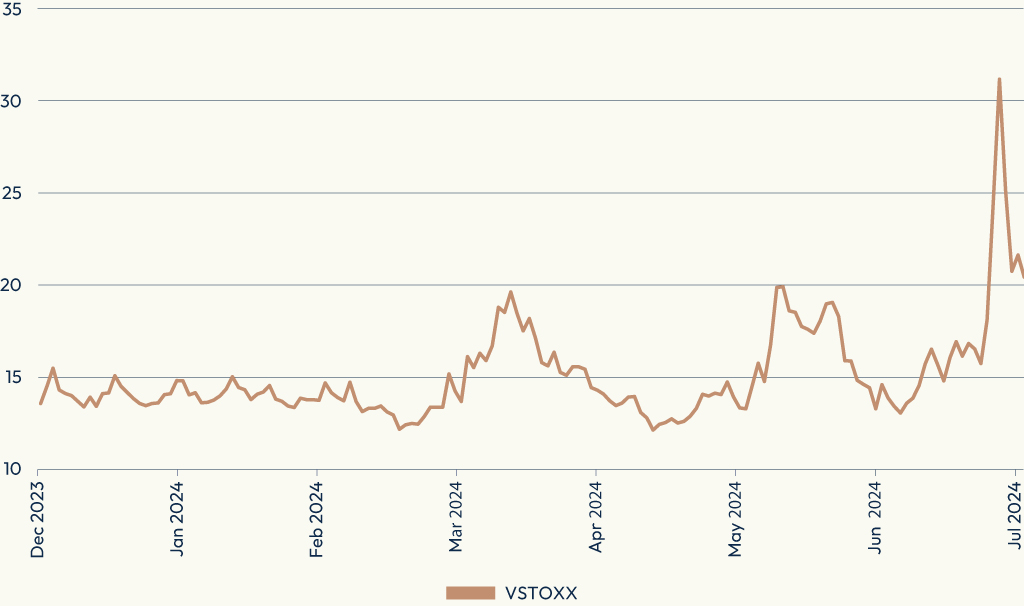
The main VSTOXX[1] almost doubled to 31.2 on August 5 from 15.7 on July 31, the steepest three-day rise since the onset of the COVID-19 pandemic in March 2020 (Figure 1). As volatility rose, the EURO STOXX 50 Volatility-Balanced index had increased its exposure to VSTOXX futures since the end of July.
Figure 1: Main VSTOXX’s performance in 2024
Negative correlation
Because it seeks to exploit the historically negative correlation between equity volatility and the underlying market, the EURO STOXX 50 Volatility-Balanced’s hypothetical portfolio can profit from market uptrends while providing insurance during volatile periods. As such, the index attempts to diversify risk across the business cycle. Importantly, the dynamic allocation is designed so the index increases its exposure to volatility futures when the market background turns negative, avoiding a constant and costly allocation.
Figure 2 shows the performance of the EURO STOXX 50 Volatility-Balanced index against the benchmark in the past ten years.
Figure 2: Ten-year returns
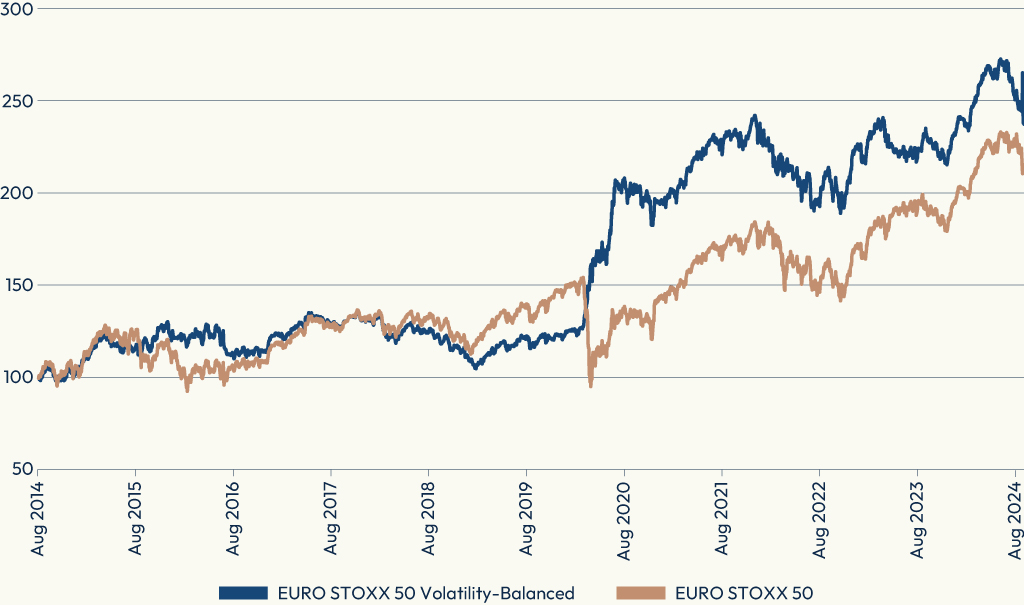
On average, the EURO STOXX 50 Volatility-Balanced index has climbed 10% every year since 2006, compared with an average gain of 6.8% for the benchmark EURO STOXX 50.[2] While the Volatility-Balanced index has provided protection during worst-case market scenarios, it has, through 2023, also posted positive returns in every year of broader market gains.
Figure 3: Annual returns since 2006
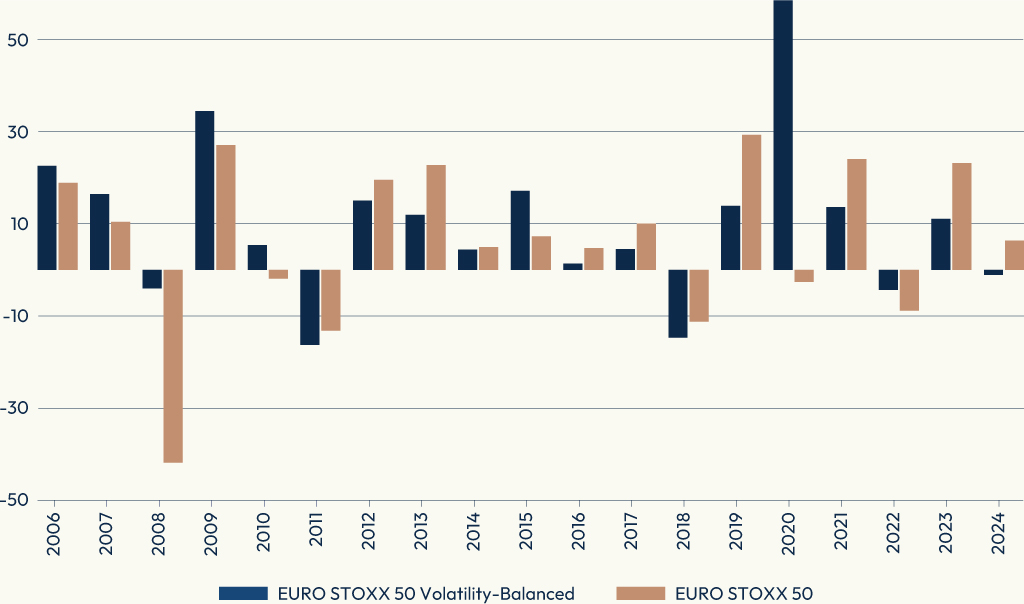
To be sure, this run includes an exceptional year such as 2020, when the COVID-19 pandemic dragged the EURO STOXX 50 down by 2.6% in the calendar year but lifted the EURO STOXX 50 Volatility-Balanced index by 59%. Excluding 2020, both the Volatility-Balanced index and the EURO STOXX 50 benchmark have climbed an average of 7.3% a year since 2006, suggesting market insurance has come at no extra cost to investors.
The performance looks even better when adjusted for market risk, an appropriate metric for a strategy that aims to provide higher risk-adjusted returns. The EURO STOXX 50 Volatility-Balanced index’s annualized volatility for the past five years is 16%, compared with 21% for its benchmark.[3] That takes the respective Sharpe ratios to 0.8 and 0.3 over the period. The annualized volatilities in the past three years, a period that does not include the COVID-19 sell-off, is 14.6% for the Volatility-Balanced index, compared with 17.9% for its benchmark.
A systematic allocation model
Investing in protection against volatility can represent a significant drag on returns during stable or bull markets. As such, replacing a fixed hedge allocation with a systematic and flexible one can make a crucial difference for overall results.
At the heart of the Volatility-Balanced index’s methodology and allocation model is a prevailing volatility environment indicator. This gauge compares the Eurozone market’s one-month actual, or realized, volatility (RV) against its one-month implied volatility (IV), in order to capture anticipated changes in the volatility environment.
When RV exceeds IV, the index switches from a ‘stable volatility regime’ to an ‘increasing volatility regime,’ triggering a higher volatility exposure (Table 1). A middle-ground scenario where RV may be moving above IV, or is close to, is reflected in a third position of an ‘unpredictable volatility regime.’ Table 1 shows the investment exposure for each one of those three scenarios. [4]
Table 1: Volatility regimes in the EURO STOXX 50 Volatility-Balanced index
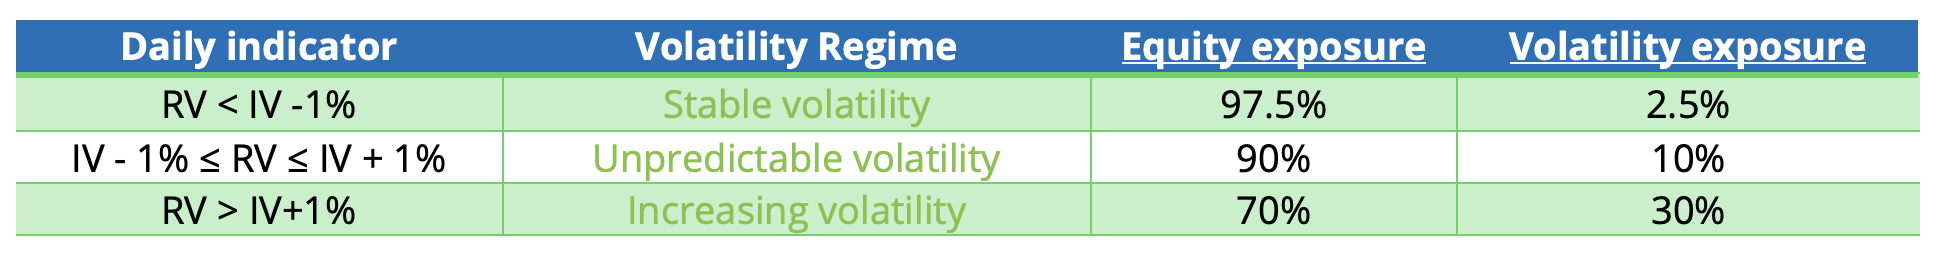
For example, the EURO STOXX 50 Volatility-Balanced index moved to an ‘unpredicted volatility regime’ on July 29 this year, lifting the allocation to VSTOXX futures to 10%. It raised that exposure to 20% on August 1 and then to 30% a day later.
The effect of large drawdowns
Of course, having a 2.5% volatility hedge during stable and/or bull markets is a drag on returns.[5] Yet a key element of the strategy is that it attempts to bypass the types of drawdowns experienced in 2008 and 2020 that can leave a long-lasting dampening effect on returns. In other words, avoiding the deep losses more than offsets missing out on the big gains.
A range of volatility indices
The EURO STOXX 50 Volatility-Balanced index is part of a wider menu of volatility-focused solutions at STOXX. The most widely tracked indices in this suite are the EURO STOXX 50 Volatility (VSTOXX) indices, which measure implied volatilities of EURO STOXX 50 Index options across their entire expiration curve and are considered the gauge for European equity volatility. Eurex-listed futures and options on the indices offer an accurate and cost-effective way to take a directional view on European volatility.
Similarly, the VDAX-New® index tracks options prices on Germany’s DAX®.
The EURO STOXX 50® Volatility of Volatility Index (V-VSTOXX) measures the implied volatility of options on VSTOXX futures, hence reflecting expectations regarding the volatility of volatility.
Volatility strategy indices include the EURO STOXX 50® Investable Volatility, which measures forward implied volatility in the Eurozone equity market, the VSTOXX® Mid-Term Futures indices, VSTOXX® Short-Term Futures Investable and VSTOXX® Short-Term Futures Inverse Investable.
The family is completed by the Dynamic VSTOXX®, which combines the VSTOXX Short-Term Futures and VSTOXX Mid-Term Futures indices to exploit the superior performance of short-term futures when the volatility forward curve is in backwardation and of mid-term futures when the volatility forward curve is in contango.
For a detailed look into all the strategies, please see a research study here.
Tail-risk protection
Short-term market swings such as the one in early August are a reminder that volatility can determine long-term performance and returns. With innovative ways to manage volatility through systematic and transparent methodologies and products, investors can protect portfolios against losses and, indeed, even take advantage of market stress.
[1] The VSTOXX indices track real-time options prices for the EURO STOXX 50, thus reflecting market expectations of future volatility – also known as implied volatility – in Eurozone stocks. The VSTOXX 30 days is the most popular, and usually referred to as “the VSTOXX.”
[2] Gross returns in euros.
[3] Data through July 31, 2024.
[4] In addition, a stop-loss criterion is applied: if the weekly performance of the EURO STOXX 50 Volatility-Balanced Excess Return index shows a loss of 5% or more, both equity and volatility allocations are moved completely into a cash position.
[5] In rising markets, the volatility strategy will suffer from not having a full exposure to equities. Additionally, there will be carry costs associated with rolling VSTOXX futures over the upward-sloping VSTOXX futures term structure.