The start of the military conflict in Ukraine on February 24 sent shockwaves across financial markets at a time when investors are already contending with high inflation and the prospect of higher-than-expected interest rate hikes.
The STOXX® Global 1800 Index fell as much as 3%1 on that day as the confrontation between Russia and Ukraine launched a war in Europe and heightened political and military tensions in the region to levels not seen since the Cold War. As the day progressed, the global benchmark pared most of its decline, but investors are nonetheless reeling from a 10% decline in the index this year.
Given the geographical proximity to the conflict zone and a deep trade relationship with Russia, Europe bore the brunt of the selling among developed-market stocks. The STOXX® Europe 600 Index fell 3.2% on February 24, while the STOXX® USA 900 Index rose 1.7%.
This has narrowed the year-to-date outperformance of Europe (Figure 1). Through February 23, the STOXX Europe 600 Index had topped the STOXX USA 900 Index by 534 basis points in 2022.2 A day later, the outperformance had shrunk to just 82 basis points (-9.8% for the European index vs. -10.7% for the USA benchmark).
Figure 1: Cumulative 2022 return
Europe’s poor performance was replicated in the week ending February 24 across all 11 industries (Figure 2).
Figure 2: Total return, February 18-24
European volatility spikes
By the same token, volatility increased much more in Europe. Figure 3 shows the EURO STOXX 50®Volatility Index, or VSTOXX®, in blue, and its US equivalent, the Cboe Volatility Index® (VIX®), in green.
While both volatility gauges followed each other closely for most of 2022, the VSTOXX, which tracks EURO STOXX 50® options prices, jumped above the VIX around mid-February, when reports emerged that President Vladimir Putin was planning a military offensive against Ukraine. By February 24, the VSTOXX closed 8 points higher than the VIX, the widest spread since March 2020 and second-biggest since April 2017.
A higher volatility reading suggests investors are paying up for options premia that offer insurance against stock price drops.
Figure 3: Volatility indices
Europe’s predicted volatility, which is based on the Axioma Short-Horizon Fundamental risk model,3 is still lower than that of the US, but popped last week (Figure 4).
Figure 4: Predicted short-horizon volatility
Share prices fall, earnings rise
European equities may still have some buffer in valuations, which have gotten cheaper on absolute and relative terms following this year’s pullback.
Figure 5 comes from Tim Craighead, European Equity Strategist at Bloomberg Intelligence.4
While forecast earnings per share in the STOXX Europe 600 have climbed between March 2020 and today (left-hand axis, blue line), the price-to-estimated-earnings ratio has fallen to 14.2 times from nearly 19 (right-hand axis, white line) in the same period. The bottom chart in Figure 5 shows European stocks are also at their cheapest relative to US shares since at least 2014, save for a brief moment in 2020.
Figure 5: STOXX Europe 600 – EPS and P/Es

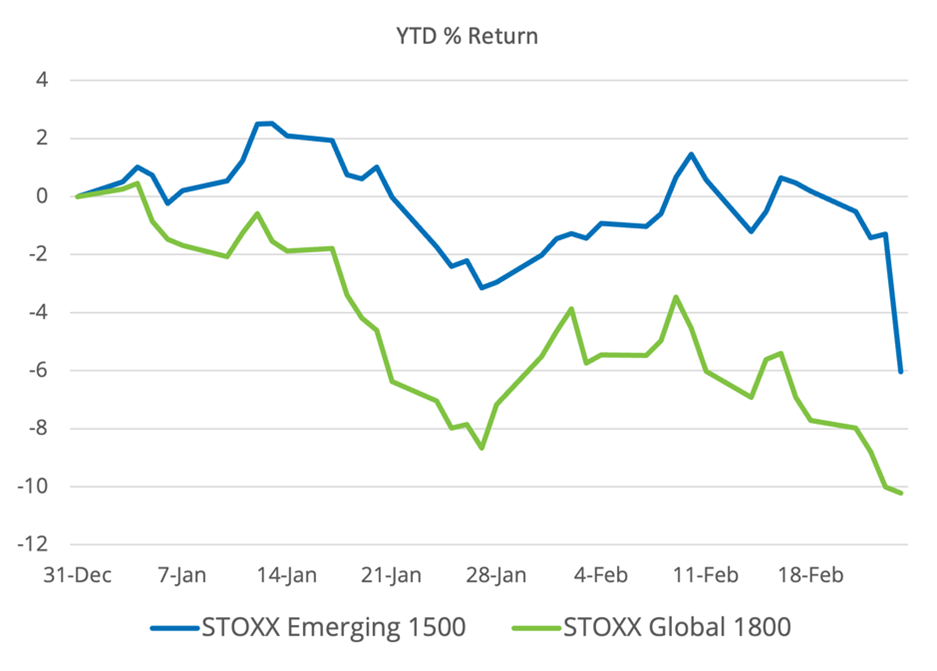
One performance differential that was even wider was that between developed and emerging markets (Figure 6). The STOXX® Emerging Markets 1500 Index, which through January 23 had beaten the STOXX Global 1800 by 860 basis points in 2022, dropped nearly 4.8% on January 24 — while the STOXX Global 1800 fell only 0.2%. Russia accounted for a third of the emerging-markets index’s decline. The STOXX® Russia Total Market Index nearly halved in value in the five days to February 24. STOXX announced on February 28 that this index will be suspended at the close of March 18, 2022.
Figure 6: Cumulative 2022 return
The predicted volatility of the emerging-markets index also spiked last week (Figure 7).
Figure 7: Predicted short-horizon volatility

“As much warning about an impending conflict as we seemed to have had, sharply down markets and substantially increased volatility suggest investors were still surprised by the events,” said Melissa Brown, Head of Applied Research at Qontigo.
Sector performance
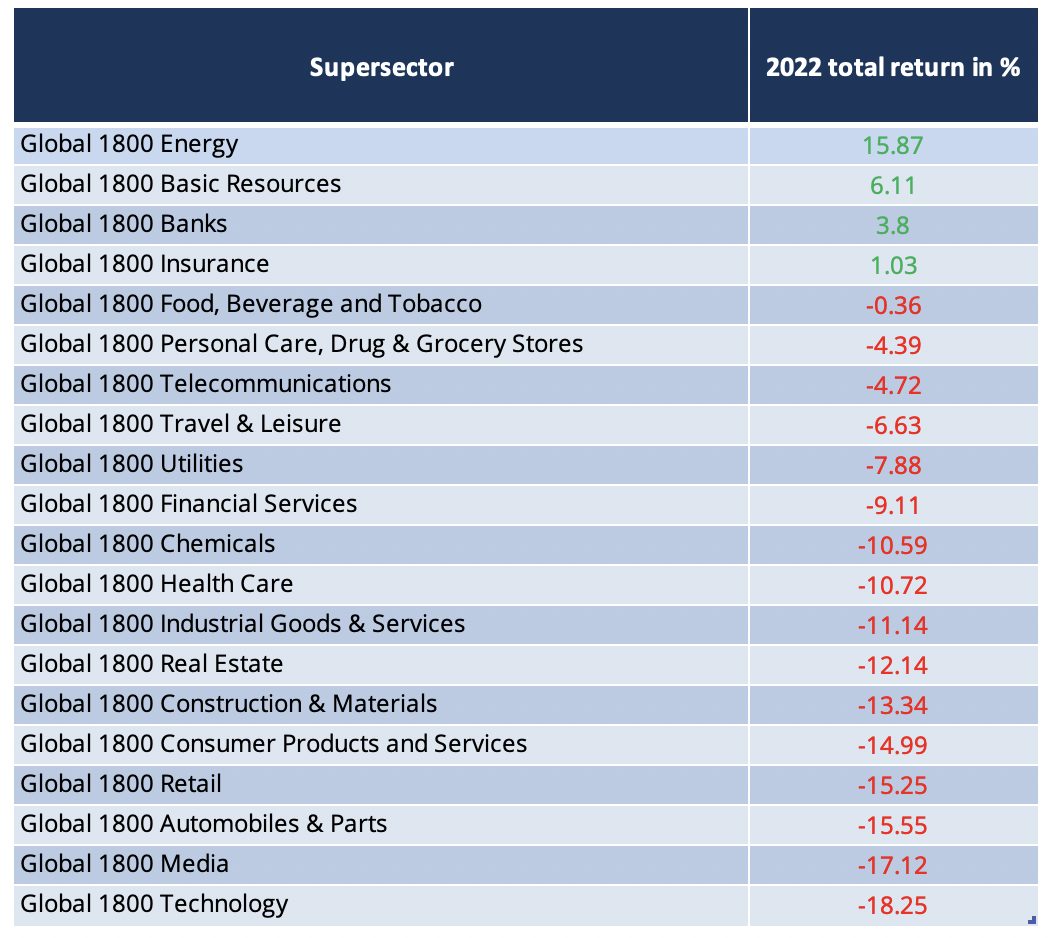
So how does year-to-date sector performance stand, following the latest events? Figure 8 shows that only four of 20 ICB industries in the STOXX Global 1800 have had a positive return in 2022 through February 24. The two best performances, energy and basic resources, are both directly linked to potential supply shortfalls from Russia, which is facing new embargoes every day. The price of Brent oil has jumped more than 30% this year to above $100 a barrel, the highest since 2014. The CRB Commodity Index has climbed 22% in 2022.
Figure 8: ICB Supersectors in 2022
Russia is the world’s third-largest producer of crude and the second-biggest gas supplier. The country is a top-3 producer of metals and commodities including gold, nickel, platinum, palladium, cobalt and potash, and has the world’s third-largest reserves of crude iron ore.5
Banks and insurers, meanwhile, are benefitting from the prospect of higher interest rates in major developed markets.
A change in outlook?
Global equity markets rebounded on February 25 yet fell again on the following session, suggesting that the uncertainty around the rapidly-evolving conflict in eastern Europe is keeping investors and traders on edge. According to Qontigo’s Brown, while all eyes are now on the clash in Ukraine, geopolitical concerns tend to wane after a while, and investors are likely to refocus on broader macroeconomic fundamentals. In particular, they will be watching the course of inflation and the response from central banks. A question that emerged last week is whether sanctions on Russia and trade disruptions may slow economic growth or tighten financial conditions, leading central banks to reconsider planned interest-rate hikes.
“Studies have shown that most conflicts have not had a lasting impact on equity markets — share prices tend to rise after a period and even become less volatile,” said Brown. “A more important concern, however, remains around the prices of oil and other commodities, and whether central banks will have to change course.”
For further analysis into risk and volatility across asset classes following the situation in Ukraine, visit Qontigo’s MAC Monitor commentary.
1 Gross returns, data as of February 24, 2022.
2 Gross returns. The STOXX Europe 600 is measured in EUR, while the STOXX USA 900 is in USD.
3 The Axioma short-horizon fundamental model provides an expectation of the market’s volatility over the next one to three months. The model exponentially weights recent returns in industry and style factors (and country and currency factors in Europe), along with market performance, and assesses correlations among the factors, to derive the risk forecast.
4 For more on this, see Bloomberg Intelligence, ‘How Russia-Ukraine Crisis Impacts STOXX 600 & Sectors: BI Analyst Briefing.’
5 Source: ABN Amro Group Economics.
