Integration of environmental, social and governance (ESG) criteria as well as product- and norms-based exclusions were both drivers of portfolio outperformance amid this year’s market distress, a new Qontigo research paper1 has found.
The study looks into returns from the EURO STOXX 50® ESG Index, which excludes stocks from the benchmark EURO STOXX 50® Index based on two criteria. Firstly, the 10% of index constituents with the lowest ESG scores are removed. Then, the same set of exclusions criteria that is used for the STOXX® ESG-X Indices – Global Standards Screening (GSS)2, involvement in controversial weapons, tobacco producers and thermal coal3 – is applied to the remaining portfolio.
Excluded companies are replaced by companies with higher ESG scores from the same Industry Classification Benchmark (ICB) supersector, fulfilling both ESG integration and negative exclusion strategies.
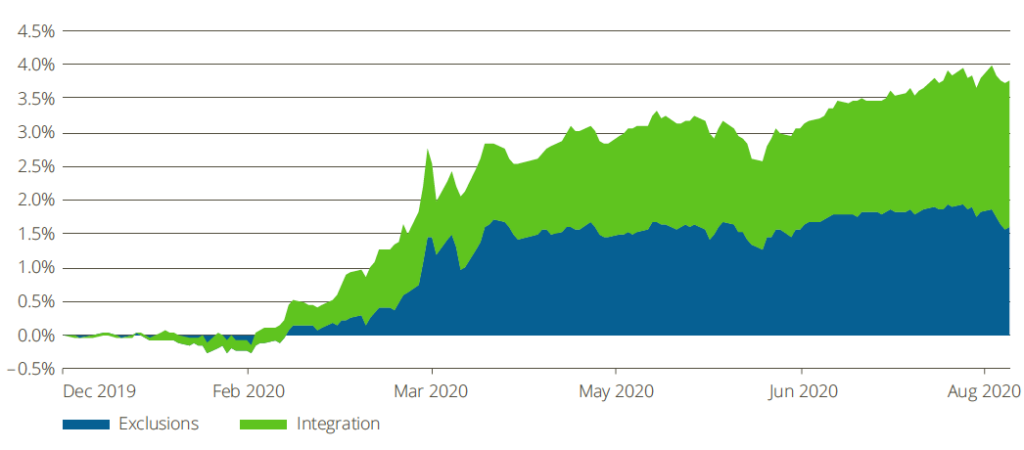
Between Dec. 20, 2019 and Aug. 7, 2020,4 the EURO STOXX 50 ESG Index outperformed the flagship EURO STOXX 50 Index by 3.77 percentage points.5 While performances were closely aligned during January, they diverged thereafter, particularly during the COVID-19 pandemic.
Excluding companies due to product- and norms-based negative screening added 1.59 percentage points of extra returns, while the remaining 2.18 percentage points are attributable to the ESG integration process of the EURO STOXX 50 ESG index (Exhibit 1).
Exhibit 1 – Cumulative impact of exclusions on total returns

Although “the EURO STOXX 50 ESG Index’s risk-return performance profile does not differ significantly from its benchmark over the long term, the ESG Index has markedly outperformed its benchmark to date in the short term during the COVID-19 pandemic while keeping volatility lower,” Anand Venkataraman, Head of Index Product Management at Qontigo, and Ladi Williams, Index Product Manager, wrote in the report. “The index therefore seems to have delivered on its intended objective of reducing higher-risk exposures by reallocating weights to securities that are relatively less risky from an ESG perspective.”
Exhibit 2, also taken from the study, shows a more detailed analysis of risk and returns. The ESG column reflects the combined strategy of replacing companies with low ESG scores as well as based on products and norms. The ESG-X column reflects only the latter, which is equivalent to the EURO STOXX 50® ESG-X Index.
Exhibit 2 – Performance analysis

Exhibit 2 also shows that the main driver of the 1.59 percentage points of excess return derived from the exclusions screens was the omission of controversial-weapons securities. As of Aug. 14 this year, the EURO STOXX 50 ESG Index had seven different securities to those of the benchmark.
Underweighted sectors
The authors also explain that although the ESG index attempts to achieve sector neutralization by selecting replacement securities from within the same industry, in some instances the replacements have much lower market capitalizations than the excluded securities. This results in unintentional sector tilts, and this year, for example, led to the ESG index being underweight in some of the sectors that have been worst affected, such as aerospace & defense.
Other findings in the study show that, overall, the ESG index boosts the portfolio’s ESG score relative to both the benchmark and the exclusions-only ESG-X index
We invite you to read the entire report here, including a factor-based attribution analysis of ESG strategies and an industry and country exposure comparison of the various indices.
Featured indices
EURO STOXX 50® ESG Index
EURO STOXX 50® ESG-X Index
1 Venkataraman, A., Williams, L., ‘EURO STOXX 50® ESG Index – Delivering on Its Objective?’ Qontigo, August 2020.
2 Global Standards Screening identifies companies that violate or are at risk of violating commonly accepted international norms and standards, enshrined in the United Nations Global Compact (UNGC) Principles, the Organisation for Economic Co-operation and Development (OECD) Guidelines for Multinational Enterprises, the UN Guiding Principles on Business and Human Rights (UNGPs), and their underlying conventions.
3 Companies that generate at least 25% of revenue from thermal coal mining and exploration and those that have at least 25% thermal coal-based power generation capacity are excluded.
4 The period’s starting date was chosen to coincide with the implementation date of the fourth quarter index review.
5 Gross returns in euros, Dec. 20, 2019 – Aug. 7, 2020.
