

STOXX has introduced the STOXX Optimal 100 indices, which track the performance of parent indices with a reduced number of constituents.
The STOXX Optimal 100 indices aim to replicate their parent indices with minimal tracking error and controlled active exposures, thanks to an optimization in the stock-selection process. In having a significantly smaller constituency, the STOXX Optimal indices offer investors a potential tool for efficient hedging of benchmark portfolios.
“The new indices aim to achieve efficiencies in the managing of portfolio hedging and liquidity through a systematic, passive approach,” said Anthony Renshaw, Director for Index Innovation at STOXX. “This is possible thanks to optimization techniques that are incorporated into the index construction.”
There are five regional indices readily available, listed below. Interested users can customize solutions covering other markets or desired exposures.
- STOXX® US Optimal 100
- STOXX® Developed World Optimal 100
- STOXX® Developed Europe Optimal 100
- STOXX® Emerging Markets Optimal 100
- STOXX® Europe 600 Optimal 100
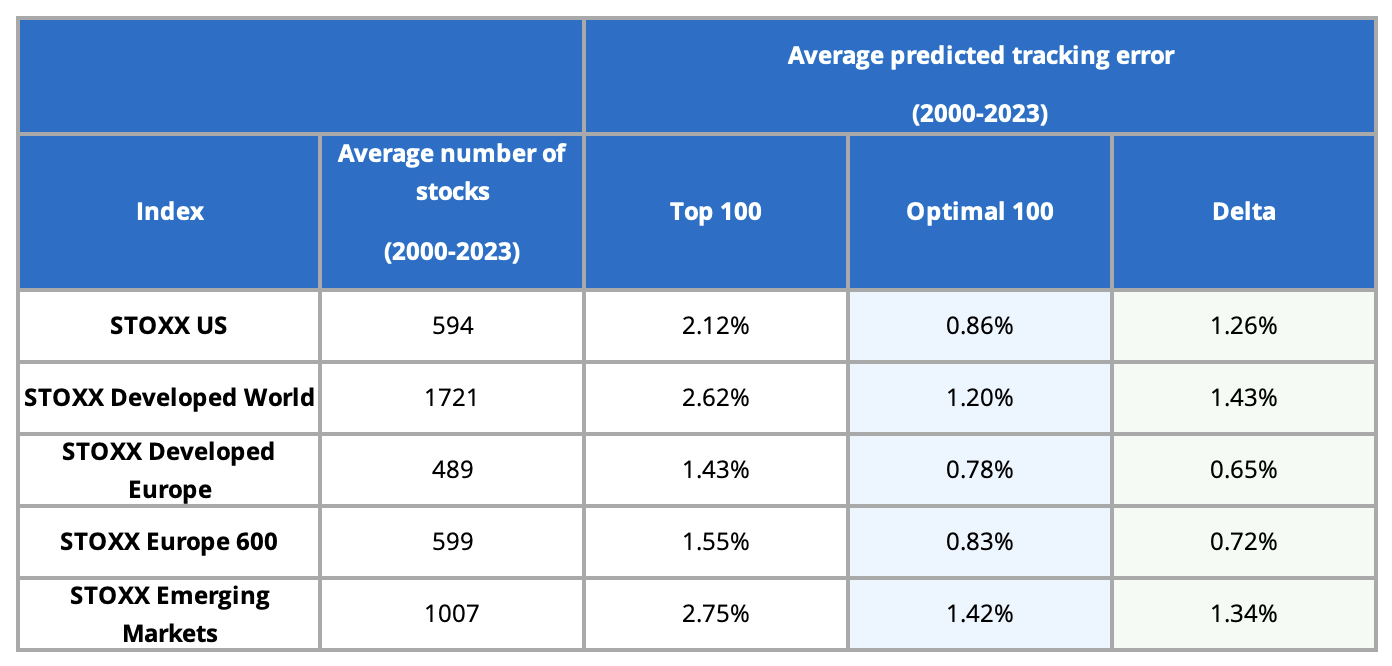
The companies and weights in a STOXX Optimal 100 index are determined by optimization based on a covariance matrix from an Axioma Risk Model, that minimizes tracking error to the parent index while holding at most 100 stocks. The predicted tracking error of the Optimal 100 basket is about half of that composed of the 100 largest companies (“Top 100”) in the parent index (Figure 1).
Figure 1: Optimal 100 characteristics – Minimizing predicted tracking error
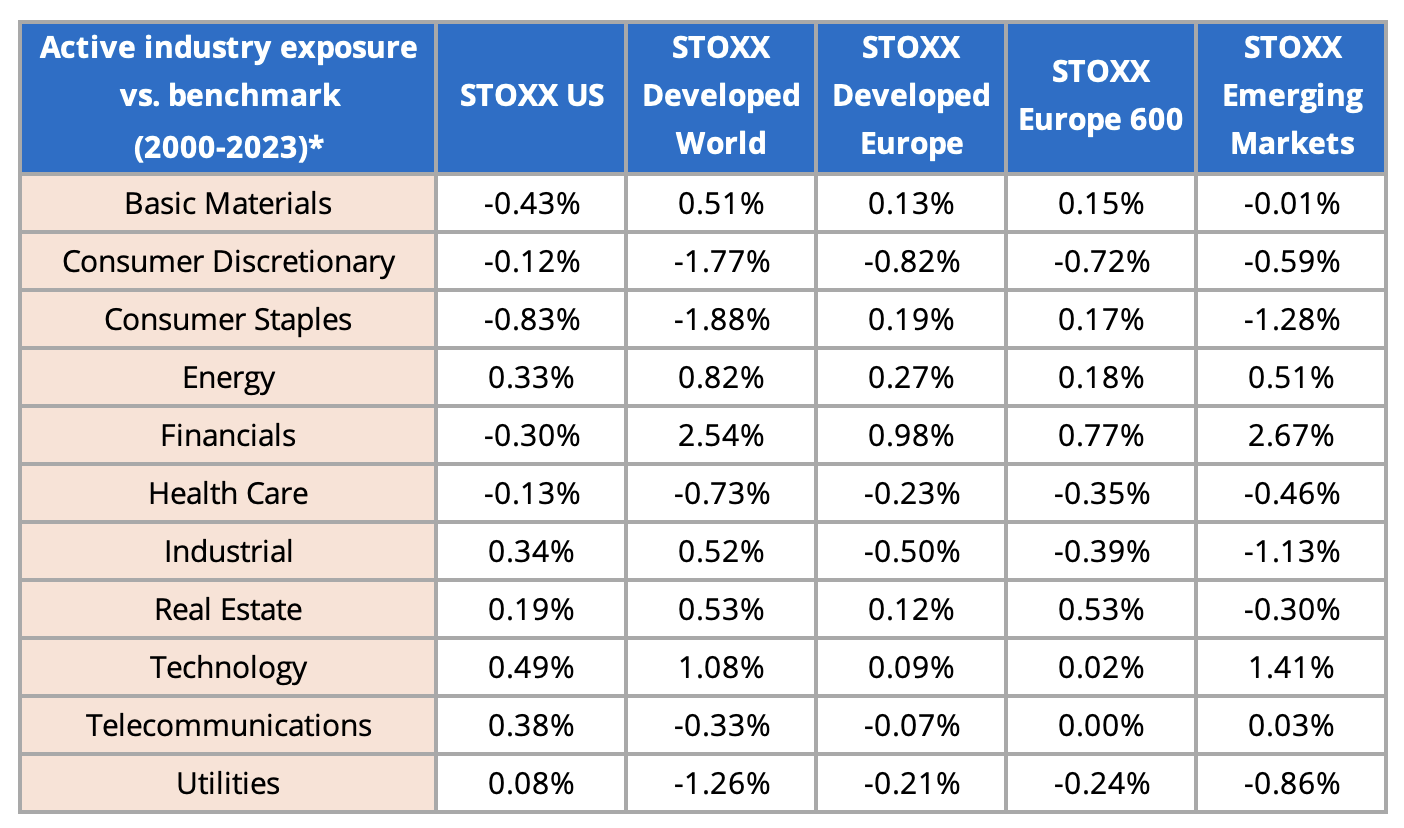
The Optimal 100 indices have historically achieved low active industry biases when compared to the parent index (Figure 2).[1] They also limit active style and country tilts.
Figure 2: Optimal 100 indices’ Industry active exposures
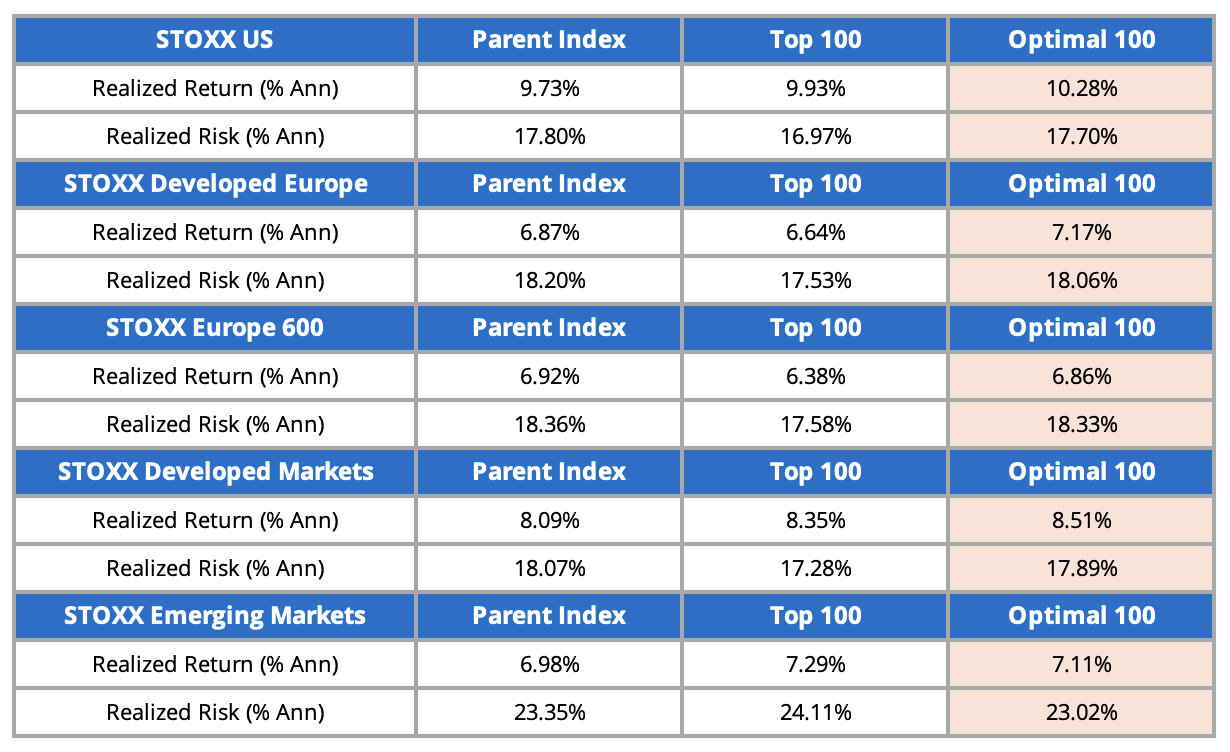
Similar risk/return profiles
Figure 3 shows that all Optimal 100 indices in the analysis had similar or higher returns, and comparable risk profiles, than their benchmarks for the backtested period between 2004 and 2023. In all but one of instances, the optimized indices beat the respective portfolios of the largest 100 stocks by market capitalization. In terms of Information Ratio, the backtested performance of the Optimal 100 compared to the Top 100 is even more impressive, since the tracking error for the Optimal 100 is roughly half that of the Top 100.
Figure 3: risk and return characteristics
The indices are weighted according to the same optimization process. They are reviewed on a semi-annual basis in March and September.
[1] Specific exceptions are the Financials Industry for the STOXX Developed World and STOXX Emerging Markets indices, and consumer-related industries for the STOXX Developed World.
Related Insights
Blog Posts
Video: Upcoming elections and market volatility. What is the VSTOXX index telling us?
Read more
Whitepapers
What’s in a sustainability fund name? In Europe, increasing rigor
Download
Blog Posts
ISS STOXX indices use comprehensive framework to help investors address biodiversity challenges
Read more