This article was first published by ETF Stream.
European equities are sometimes seen as a ‘value’ market with only moderate growth. However, inflows into European equities are gathering pace this year. With the region’s activity accelerating, and valuations at multi-year discounts to the US, investors are taking notice once again. Arun Singhal, Global Head of Product Management at STOXX, speaks to ETF Stream Editor Theo Andrew about the European equity market and the role indices play.
European equities are having a good year judging by prices and flows. What’s driving this interest?
“ETFs with a European equities remit that are domiciled in Europe have received a net EUR 7.1 billion so far this year, more than the EUR 5.9 billion in all of 2023, and compared with outflows of EUR 8.5 billion in 2022.[1]
We’ve seen several years of headwinds within the European market in terms of allocation. Even if European indices did well in 2021 and 2023, many investors overweighted other regions – particularly the US – as they sought exposure to hot sectors and themes within the Technology industry.
What we have noticed since late last year is a reversal of that sentiment towards European markets. There are several tailwinds behind that, whether that is market dynamics, valuations or the macroeconomic background.”
Can you explain what those shifts in market dynamics are?
“What we hear from clients, mainly, is that they are being more discerning given the strong rally we’ve had in markets such as the US. When investors look at Europe, they not only see a market that offers a source of diversification, but also one with very attractive valuations compared to other regions.
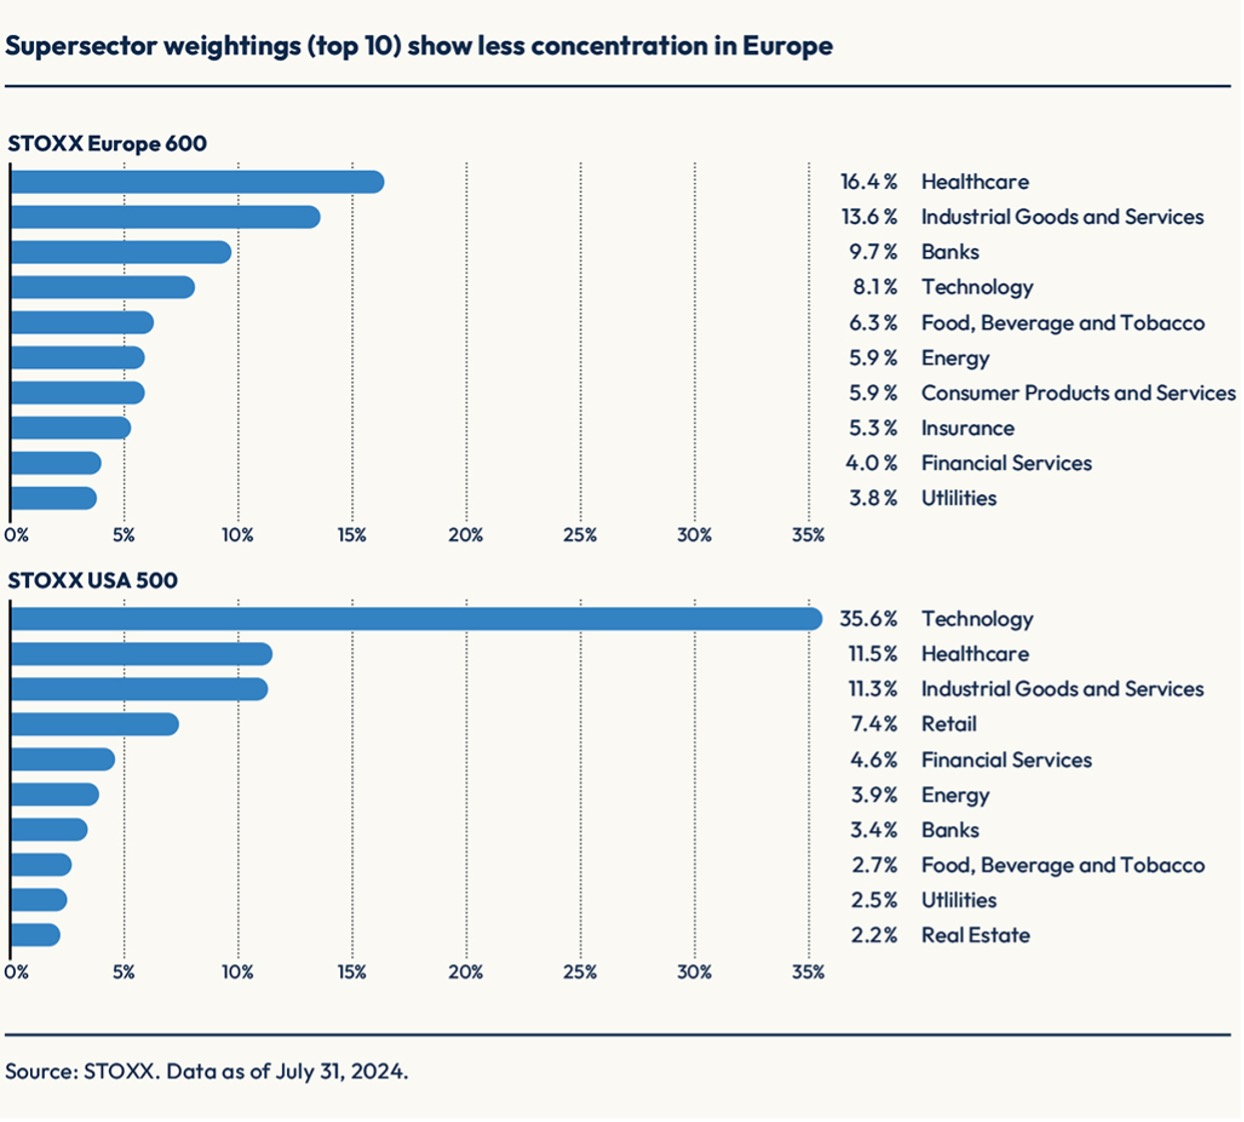
This provides a relative hedge against the overconcentration risks that may appear in markets such as the US – where the largest companies are all from Technology.

The top ten holdings make up 22% of the STOXX Europe 600, compared with 34% for the top ten in the STOXX USA 500. According to the Herfindahl-Hirschman Index, the STOXX Europe 600 has an effective number of stocks of 121, more than double the 53 of the STOXX USA 500. The higher the effective number of stocks, the more diversified a portfolio is. Concentration presents a liability for investors, and they are therefore seeking to reduce that risk by allocating to other sectors and regions.
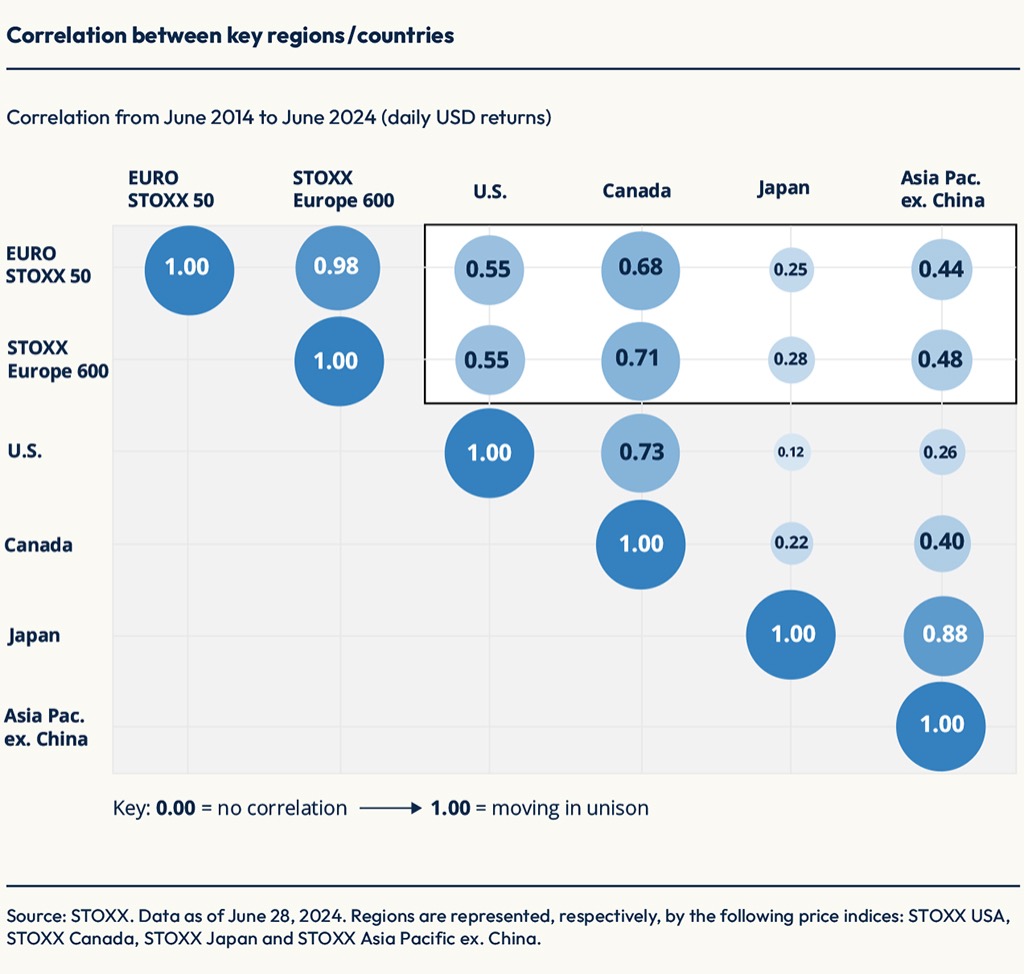
This also has connotations for correlations. The correlation of the STOXX EUROPE 600 and the EURO STOXX 50 to a core US index is 0.55, a low not seen in quite some time. A correlation of 1.0 means two asset classes move in tandem, while 0.55 suggests there is significant diversification between the two.”

Europe seems to be a perpetual “value region.” Is that changing?
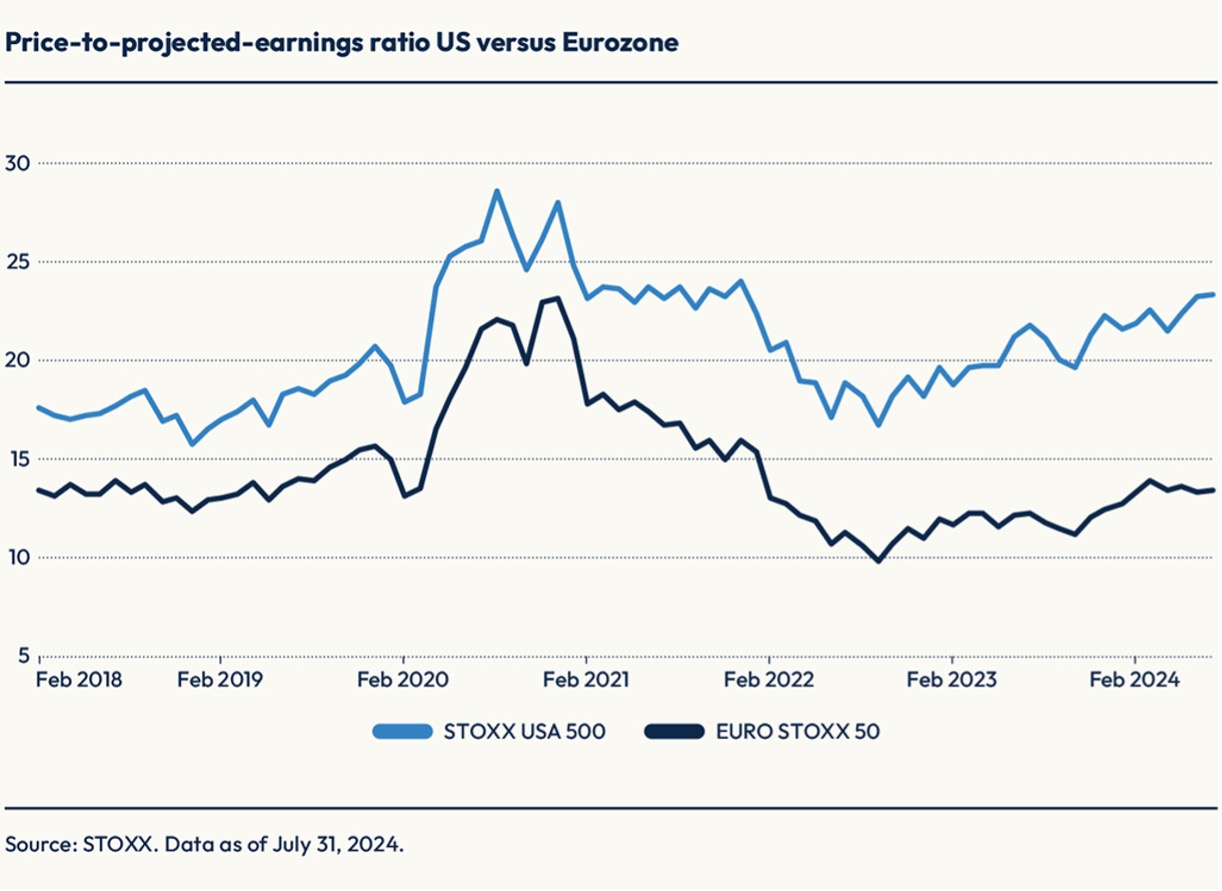
“While the STOXX USA 500 is a third more expensive than in 2018 relative to its constituents’ expected profits, the EURO STOXX 50 has remained at the same price, despite its 75% rally since then.[2]
European valuations haven’t been this low vs. the US in some time. It is interesting to see this dynamic when they are both developed markets.

Of course, low valuations are an attractive factor, but you need a trigger to turn that into good value. That may now be coming from an improving economic picture, as the Eurozone seems to be leaving a period of stagnation behind. The International Monetary Fund has forecast the Eurozone will grow by 0.9% in 2024, nearly twice the 0.5% achieved in 2023, buoyed by household consumption.[3] The expansion should accelerate to 1.5% in 2025, the agency has said. While that last rate may still not seem extraordinary, it will be converging with that in the US.
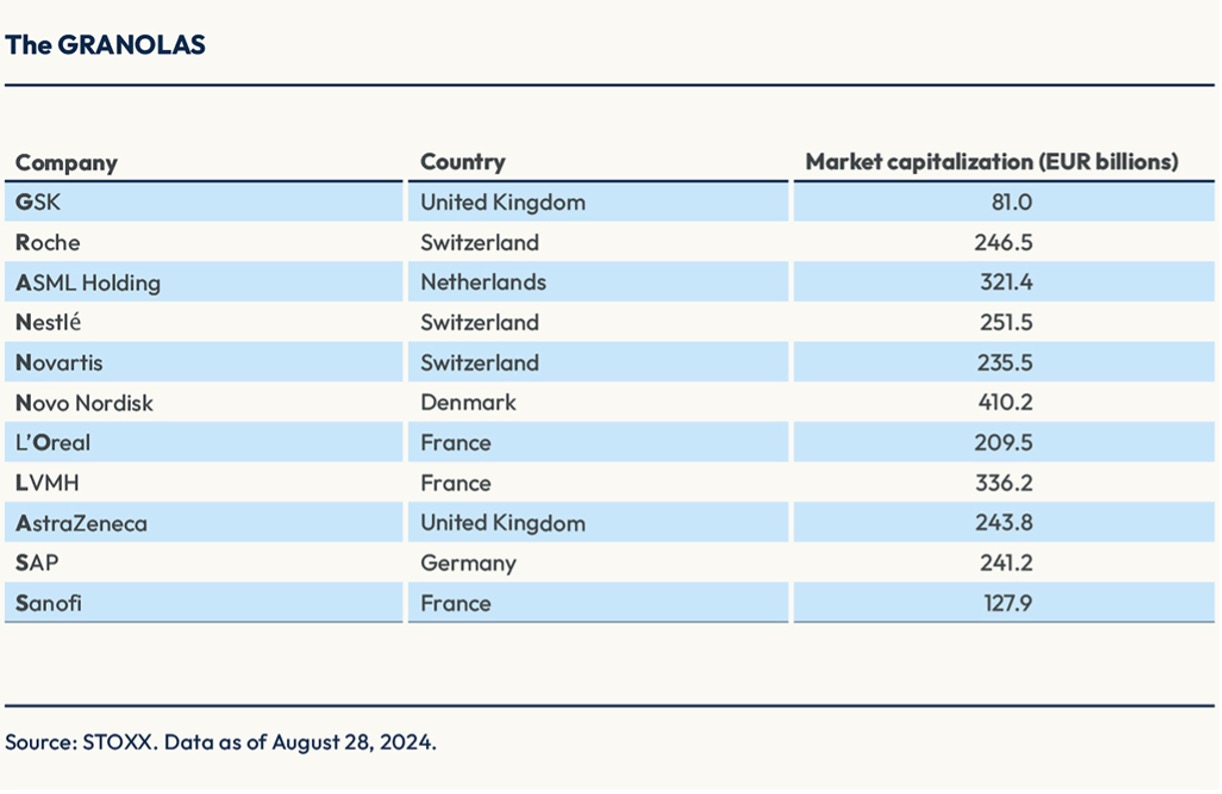
Despite below-average economic growth, European benchmarks have been lifted by companies with large international revenue exposure, steady earnings growth and solid balance sheets, a group that has been referred to as the ‘GRANOLAS.’ That group accounts for about a fifth of the STOXX Europe 600 but has this year contributed as much as 60% of the benchmark’s gains,[4] and according to Goldman Sachs’ analysis,[5] it has even beaten the so-called ‘Magnificent Seven’ in the US on a risk-adjusted basis.”
Can you expand a bit on the GRANOLAS?
“The name GRANOLAS was coined by Goldman Sachs in 2020 and is an acronym for a group of 11 companies. They stand out for the quality factors just mentioned, as well as for not being dependent on the domestic market.
Unlike the Magnificent Seven in the US, the GRANOLAS are a diversified cohort, drawn from the Healthcare, Technology, Consumer Staples and Consumer Discretionary ICB Industries. The Magnificent Seven are mostly Technology stocks, except for Amazon and Tesla, which are Consumer Discretionary.”

The EURO STOXX 50 has been the flagship benchmark for Eurozone equities since launch in 1998. What makes it so popular?
“The EURO STOXX 50 had a first-mover advantage, and given the liquidity in products linked to the benchmark and its transparent methodology, it is the go-to reference and most-followed benchmark for Eurozone blue chips. Almost 500 million options and futures on the EURO STOXX 50 index traded in 2023 on Eurex, making them some of the world’s most liquid derivatives.
The index tracks the leaders from each of 20 ICB Supersectors in the Eurozone, so there is no overconcentration into fashionable industries as happens with traditional market cap-weighted indices.
The STOXX Europe 600, for its part, is a broader index that covers 17 national markets across developed Europe. It consists of a fixed number of constituents, and it stands out for its popular sub-indices including sector and size strategies.
The EURO STOXX 50, STOXX Europe 600 and Germany’s DAX are among the most popular indices to benchmark European portfolios. As all STOXX indices, they are rules-based, representative of the underlying market and investable. These are attributes that have placed them at the center of an extensive and liquid ecosystem of investment products, including ETFs, listed derivatives and structured products, that help investors efficiently access the European equity market, hedge and manage portfolios. Together with other indices from STOXX, they underlie more than EUR 200 billion invested in ETFs and open-ended funds.”
These days there is one EURO STOXX 50 and one STOXX Europe 600, but also a family of indices around those benchmarks. What does that say about the modern investment landscape?
“The creation of comprehensive sets of indices derived from main benchmarks is evidence of the seismic change in the passive segment since the first European benchmarks were introduced in the late 1990s. As the benefits of systematic, rules-based and low-cost solutions became clearer, investment firms – from asset owners to money managers and banks – have demanded index solutions that can replicate traditionally ‘active’ portfolio strategies more efficiently. In this sense, we’ve seen inflows into sector, dividend, strategy-based and thematic indices.
ESG, of course, has been a standout story in recent years. The EURO STOXX 50 ESG and the STOXX Europe 600 SRI indices, to name only two, are already popular benchmarks used by institutional investors. STOXX launched its first sustainability index in 2001 and among our latest offerings there is a complete range of Paris-aligned benchmarks (PABs) and Climate-transition benchmarks (CTBs).
Benchmarks play a vital role as performance measurement tools but increasingly serve as the base upon which to serve the tailored requirements of clients, without losing the accuracy, transparency and reliability of indices.”
That leads me to the last question: what lies ahead in the indexing world?
“We continue to witness a steady acceleration in data and technology, which is moving us to the next chapter in the indexing story. We are already seeing it: investors are now able to index the most complex strategies – from optimized weightings to impact objectives such as investing with biodiversity-focus overlays.
Driven by increased regulation, new responsible investing requirements and evolving investor needs, institutional clients and product issuers are seeking solutions that can achieve very precise targeted objectives. This calls for co-developing indices in a hyper-customized interaction with clients.”
[1] Source: ETFBook, data through August 29, 2024.
[2] Source: STOXX. Data between February 28, 2018 and July 31, 2024, in euros, gross returns.
[3] IMF, “World Economic Outlook,” July 2024 update.
[4] Source: STOXX. Price data in US dollars from February 9, 2023, to February 9, 2024.
[5] Goldman Sachs, “The Magnificent GRANOLAS,” February 2024.
