
By Anthony Renshaw, Associate Director, Index Innovation, STOXX.
In this article, we compare two approaches to carbon emissions reduction:
(1) Excluding “N-names” with the largest carbon emissions while cap-weighting the other stocks; and
(2) Using an optimizer and risk model to minimize tracking error to a parent index while imposing a fixed reduction in carbon emissions.
Backtests over the last 3.5 years show that these two approaches are similar up to a reduction of 60% to 70%. Above this threshold, one or more high-emissions sectors (e.g., Utilities) reduce their sector emissions by more than 85%, and further reductions within those sectors are limited. Unsurprisingly, once those high-emissions sectors become tapped out, different portfolio construction approaches lead to different portfolios.
Two approaches to portfolio decarbonization
Many responsible-investing mandates impose a reduction of the weighted-average carbon emissions intensity (WACI) of the portfolio. We compare two different approaches to this portfolio construction problem:
- Exclusion: For a fixed reduction in carbon emissions, the N-names with the largest carbon emission scores are excluded and the remaining holdings are cap-weighted. N is the smallest integer such that the required carbon emissions reduction is achieved.
- Optimization: Portfolio construction software is used together with a factor risk model to find the portfolio that minimizes the predicted tracking error while imposing the prescribed reduction in carbon emissions.
We perform a backtest with monthly rebalancing from January 2021 through April 2024. Carbon emissions is measured using the ISS Climate Total Emissions USD data (Scope 1 + 2, in million tons CO2 per USD revenue), and the portfolio WACI reduction is prescribed. For the optimization approach, we use the Axioma optimizer and risk models[1] with a long-only strategy that minimizes predicted tracking error subject to the prescribed WACI reduction.
Figures 1 and 2 show the resulting predicted tracking error and stocks held for the STOXX® US and STOXX® Developed Europe indices. The exclusion approach is in green, while the optimization approach is in blue.
Figure 1: STOXX US index
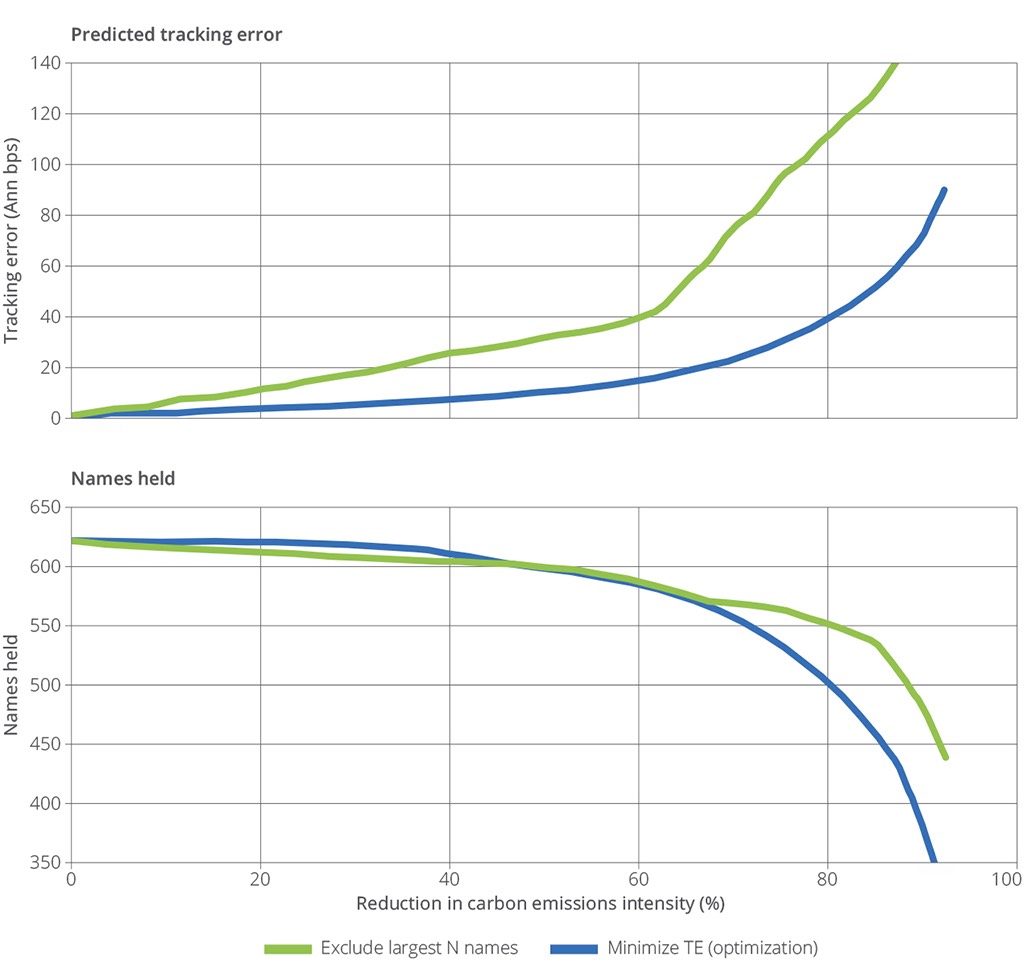
Figure 2: STOXX Developed Europe
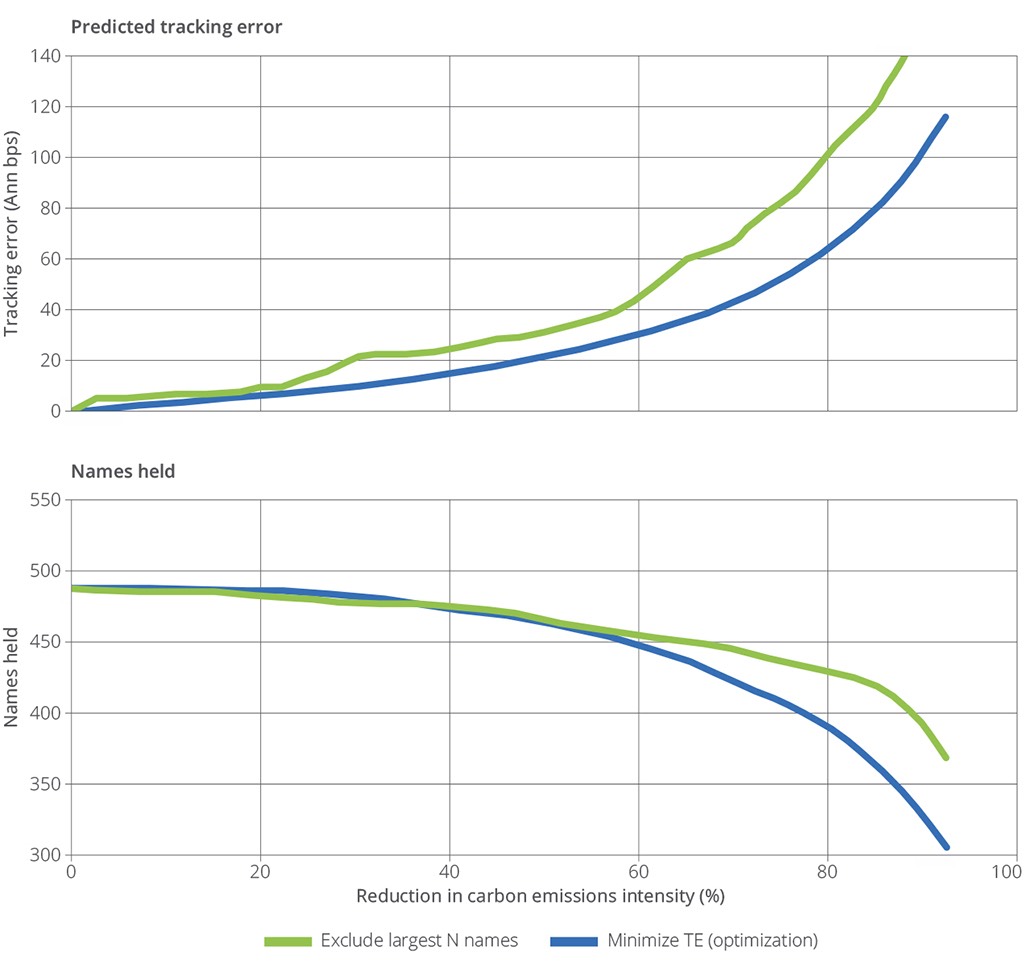
The portfolios created by these two approaches are similar up until a reduction of 60% to 70%. That is, up to that point, both methods roughly exclude the same, high carbon-emissions stocks. Around either 60% or 65%, the number of holdings for each approach starts to diverge, with the optimized portfolio holding notably fewer stocks than the exclusion approach.
The optimized predicted tracking error is typically about 20 basis points (bps) less than the predicted tracking error for the direct exclusion approach for a WACI reduction of 60%. The optimized tracking error is always less than the exclusion tracking error, otherwise the optimizer would be faulty. The 20 bps tracking error indicates some small differences in the portfolios, particularly with respect to asset weighting. The exclusion approach weights the non-excluded holdings in a pro-rata fashion while optimization can adjust weights as necessary to minimize active exposures and overall tracking error.
What happens at 60% to 70% WACI reduction? At this level, one or more of the high-emissions sectors becomes completely depleted. Once more than 85% of the carbon emissions have been eliminated from a high-emissions sector by downweighting or excluding those companies, additional reductions within that sector are scarce, and we start to see a dependence on the chosen portfolio construction approach.
Tables 1 and 2 illustrate the WACI reductions by sector (ICB Level 1) for a 50% and 75% WACI reduction.
Table 1: Emissions reduction – STOXX US
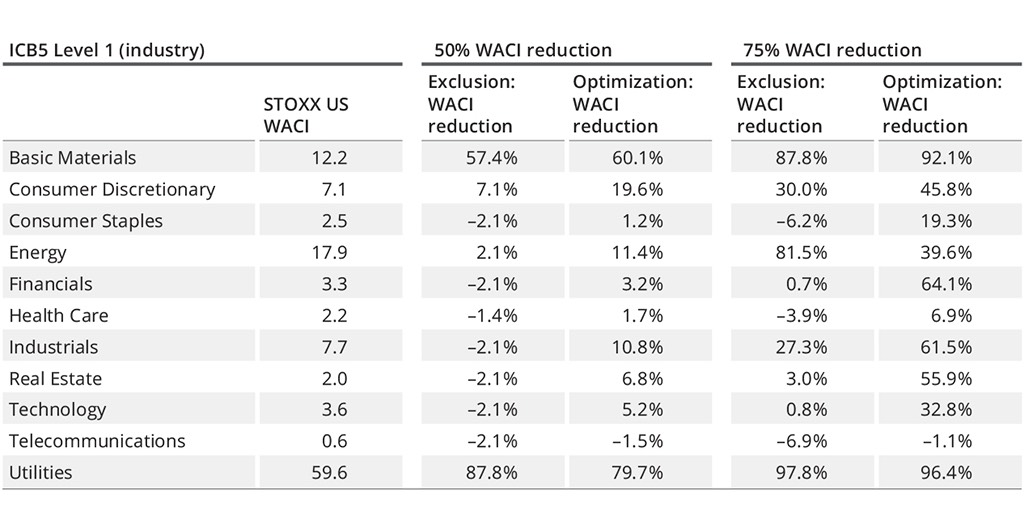
Table 2: Emissions reduction – STOXX Developed Europe
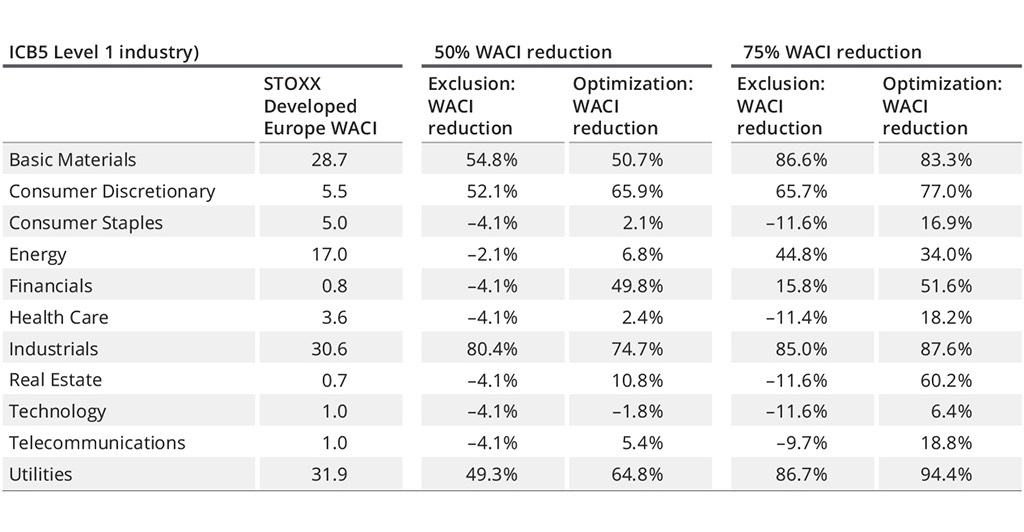
The high-emissions sectors in the US are Utilities (59.6), Energy (17.9) and Basic Materials (12.2). For the STOXX Developed Europe universe, those sectors are Utilities (31.9), Industrials (30.6), Basic Materials (28.7) and Energy (17.0).
For a 50% overall WACI reduction in the parent index, the maximum decarbonization for any sector is 87.8% (US Utilities), which still leaves some room for additional Utilities reductions. However, for a 75% WACI reduction, the US Utilities sector’s emissions have already been cut by 96% or 97%. In Europe, Utilities’ emissions have been reduced by either 87% or 94%. Hence, once overall WACI reduction is more than 70%, there is little additional decarbonization that can be achieved from the Utilities sector.
Although not shown here, the results are similar in the STOXX® Developed Asia-Pacific, STOXX® Developed World, and STOXX® Emerging Markets universes.
Obviously, the results presented here are highly simplified. Real-world investment portfolios manage more than three metrics (stocks held, tracking error and WACI reduction), and the portfolio construction approach could involve exclusions and optimization simultaneously. Nevertheless, the central idea presented here that WACI reductions become more challenging once one or more high-emissions sectors have been tapped out may be useful for guiding future WACI reductions. These results indicate that that transition occurs at 60% to 70% WACI reduction.
[1] AXUS4-MH and AXWW4-MH.